How to set maximum 100% for TopN visuals?

I have created a TOPN visual for percentage CPU usage, I created a visual in TSVB - > Time series, done all settings for axis min and max values. once its shows 100% max on the x-axis, I change the visual to TOPN. but it's not showing usage bar with respect to 100%. for 4% itself bar is totally filled.

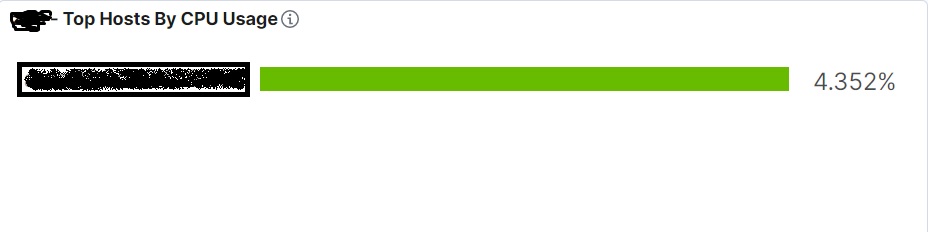
How can I change it max as 100%, and bar should fill with respect to 100%

I am not sure where the problem is. Is it in your data or if it is in the panel configuration?

Could you share your panel configuration? Do you actually have 4.352% cpu coming from the data or is this the result of a sum aggregation?

This topic was automatically closed 28 days after the last reply. New replies are no longer allowed.