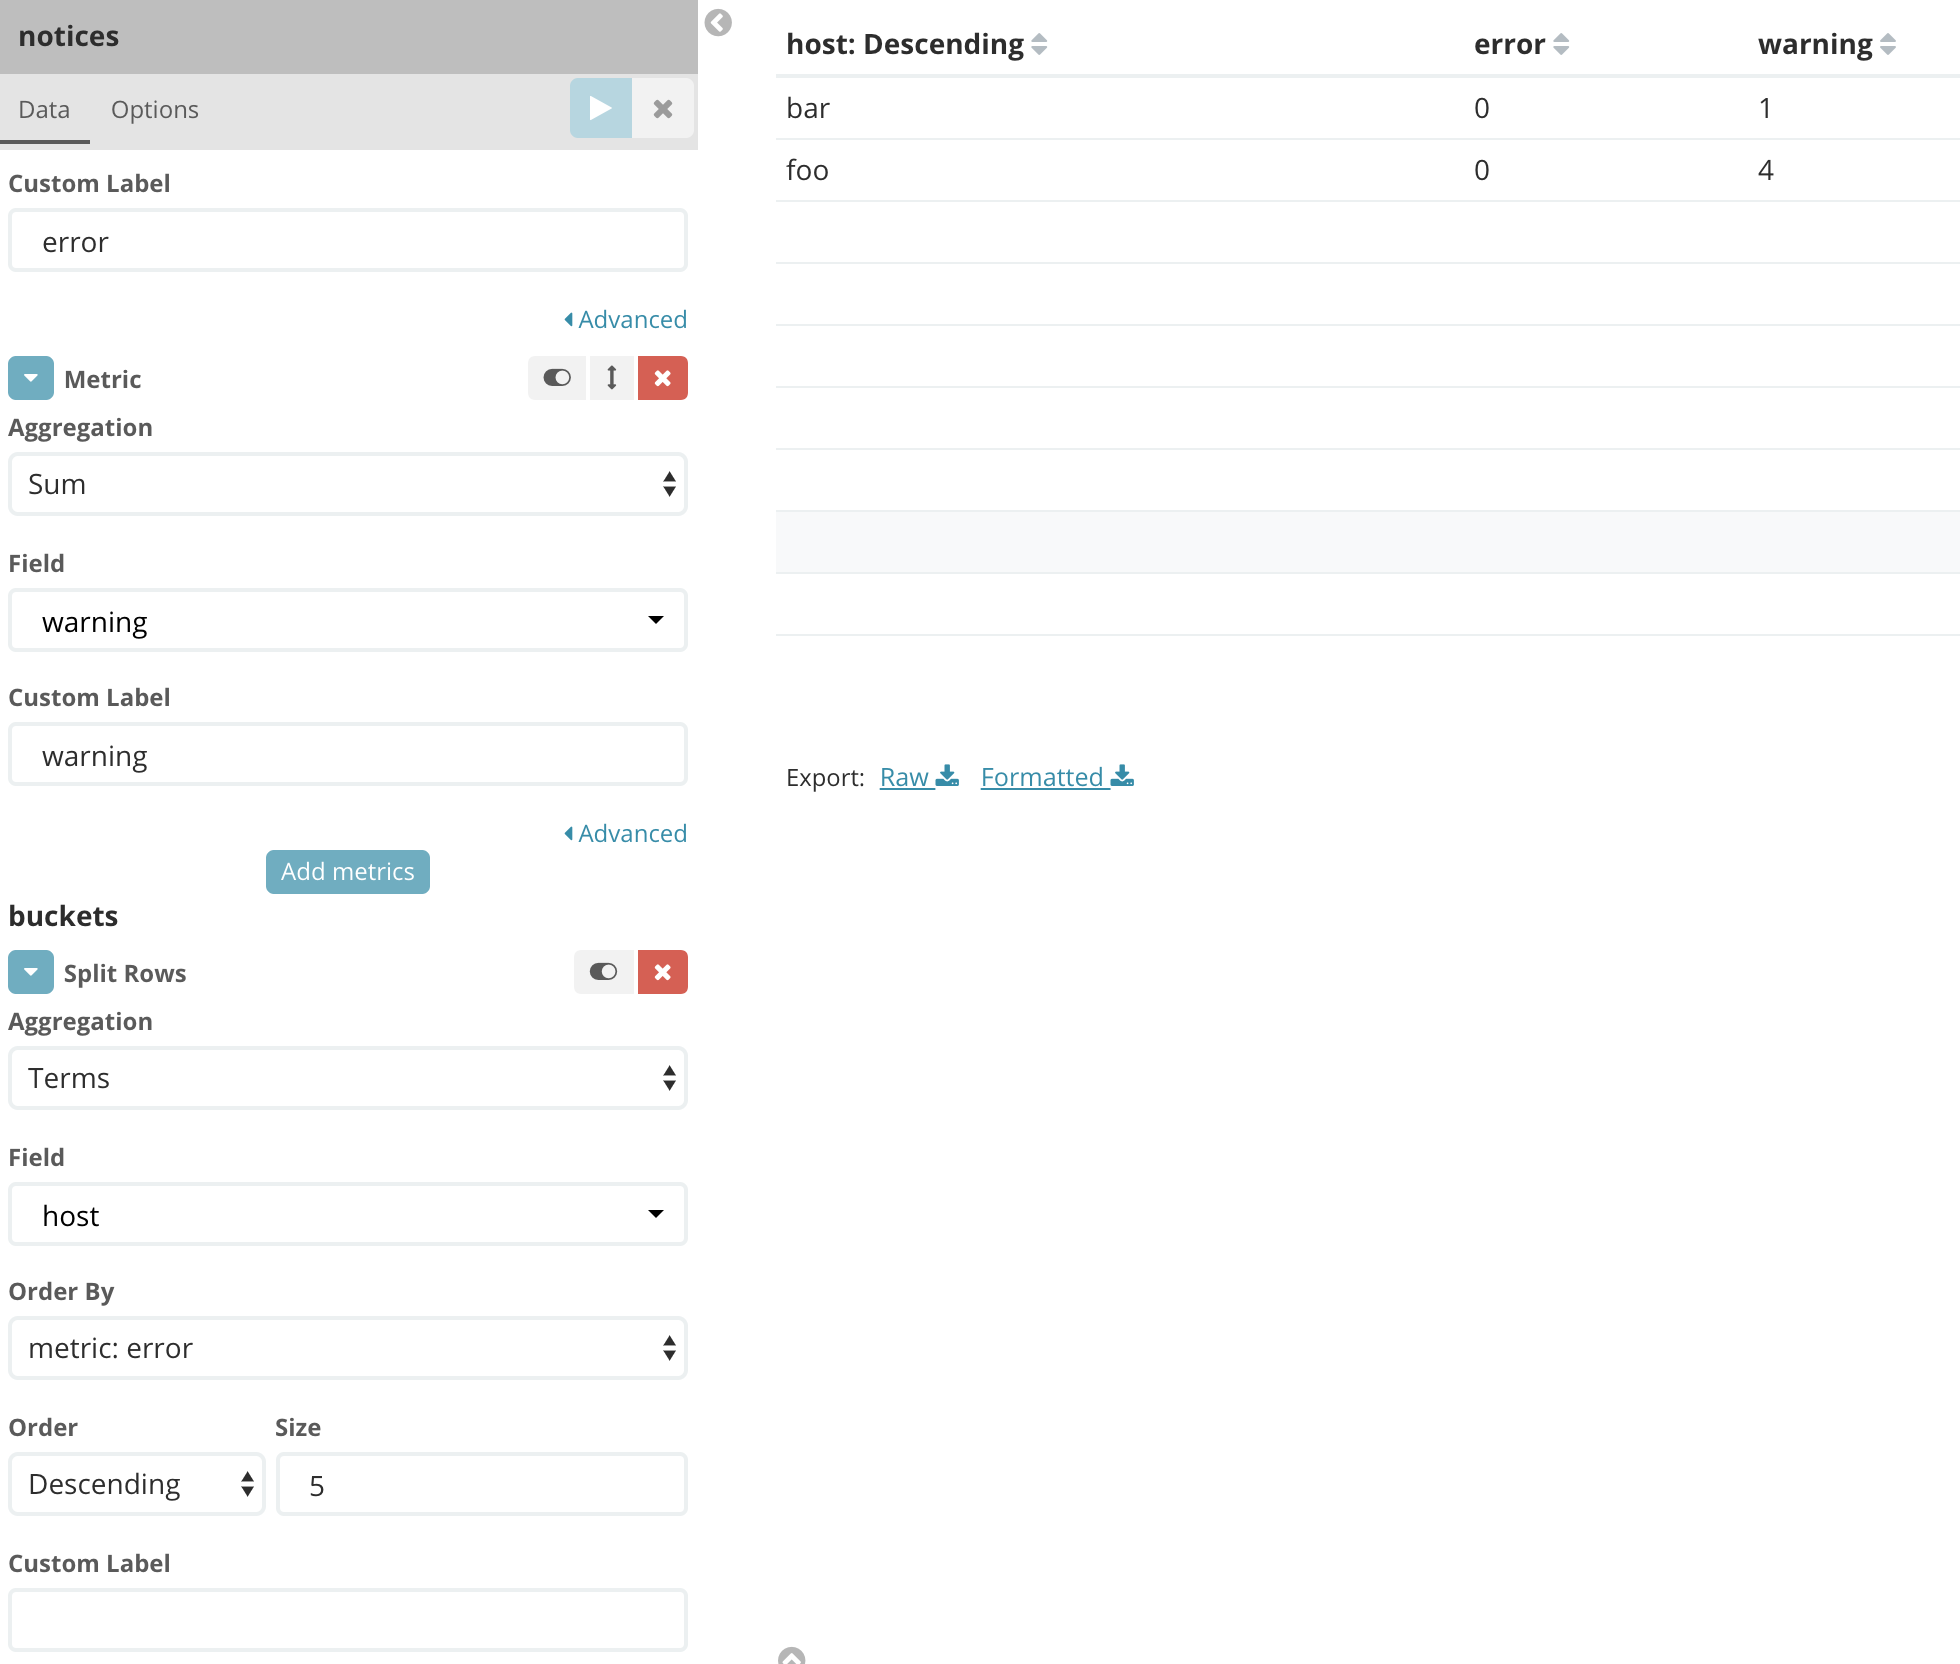
I am attempting to create a chart/data table that shows column headers that may or may not have data for a particular time range associated with the chart/data table. See the below screenshot for an example:
As you can see for this particular time range, Emergency, Alert, Critical, Error, and Debug shows a value of zero. But another day some of these headers might have a value more than zero. How do I go about creating the same chart in Kibana? I'm using the Data Table for the visualization but not having luck on figuring this out.
Apache, Apache Lucene, Apache Hadoop, Hadoop, HDFS and the yellow elephant
logo are trademarks of the
Apache Software Foundation
in the United States and/or other countries.