Hello,
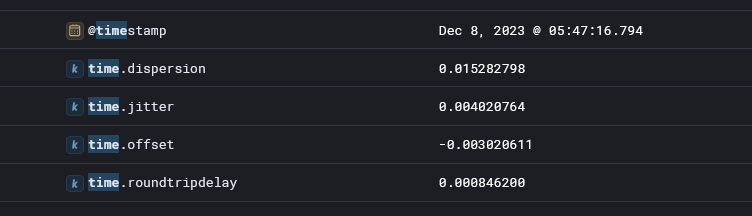
I am on Elastic V8.10.4 and I have a dashboard for NTP that looks like this:
I want it to show only one entry per day, instead of multiple per day like it currently does. How can I accomplish this?
Hi @soad20000 I think you have to aggregate by timestamp to accomplish what you want.
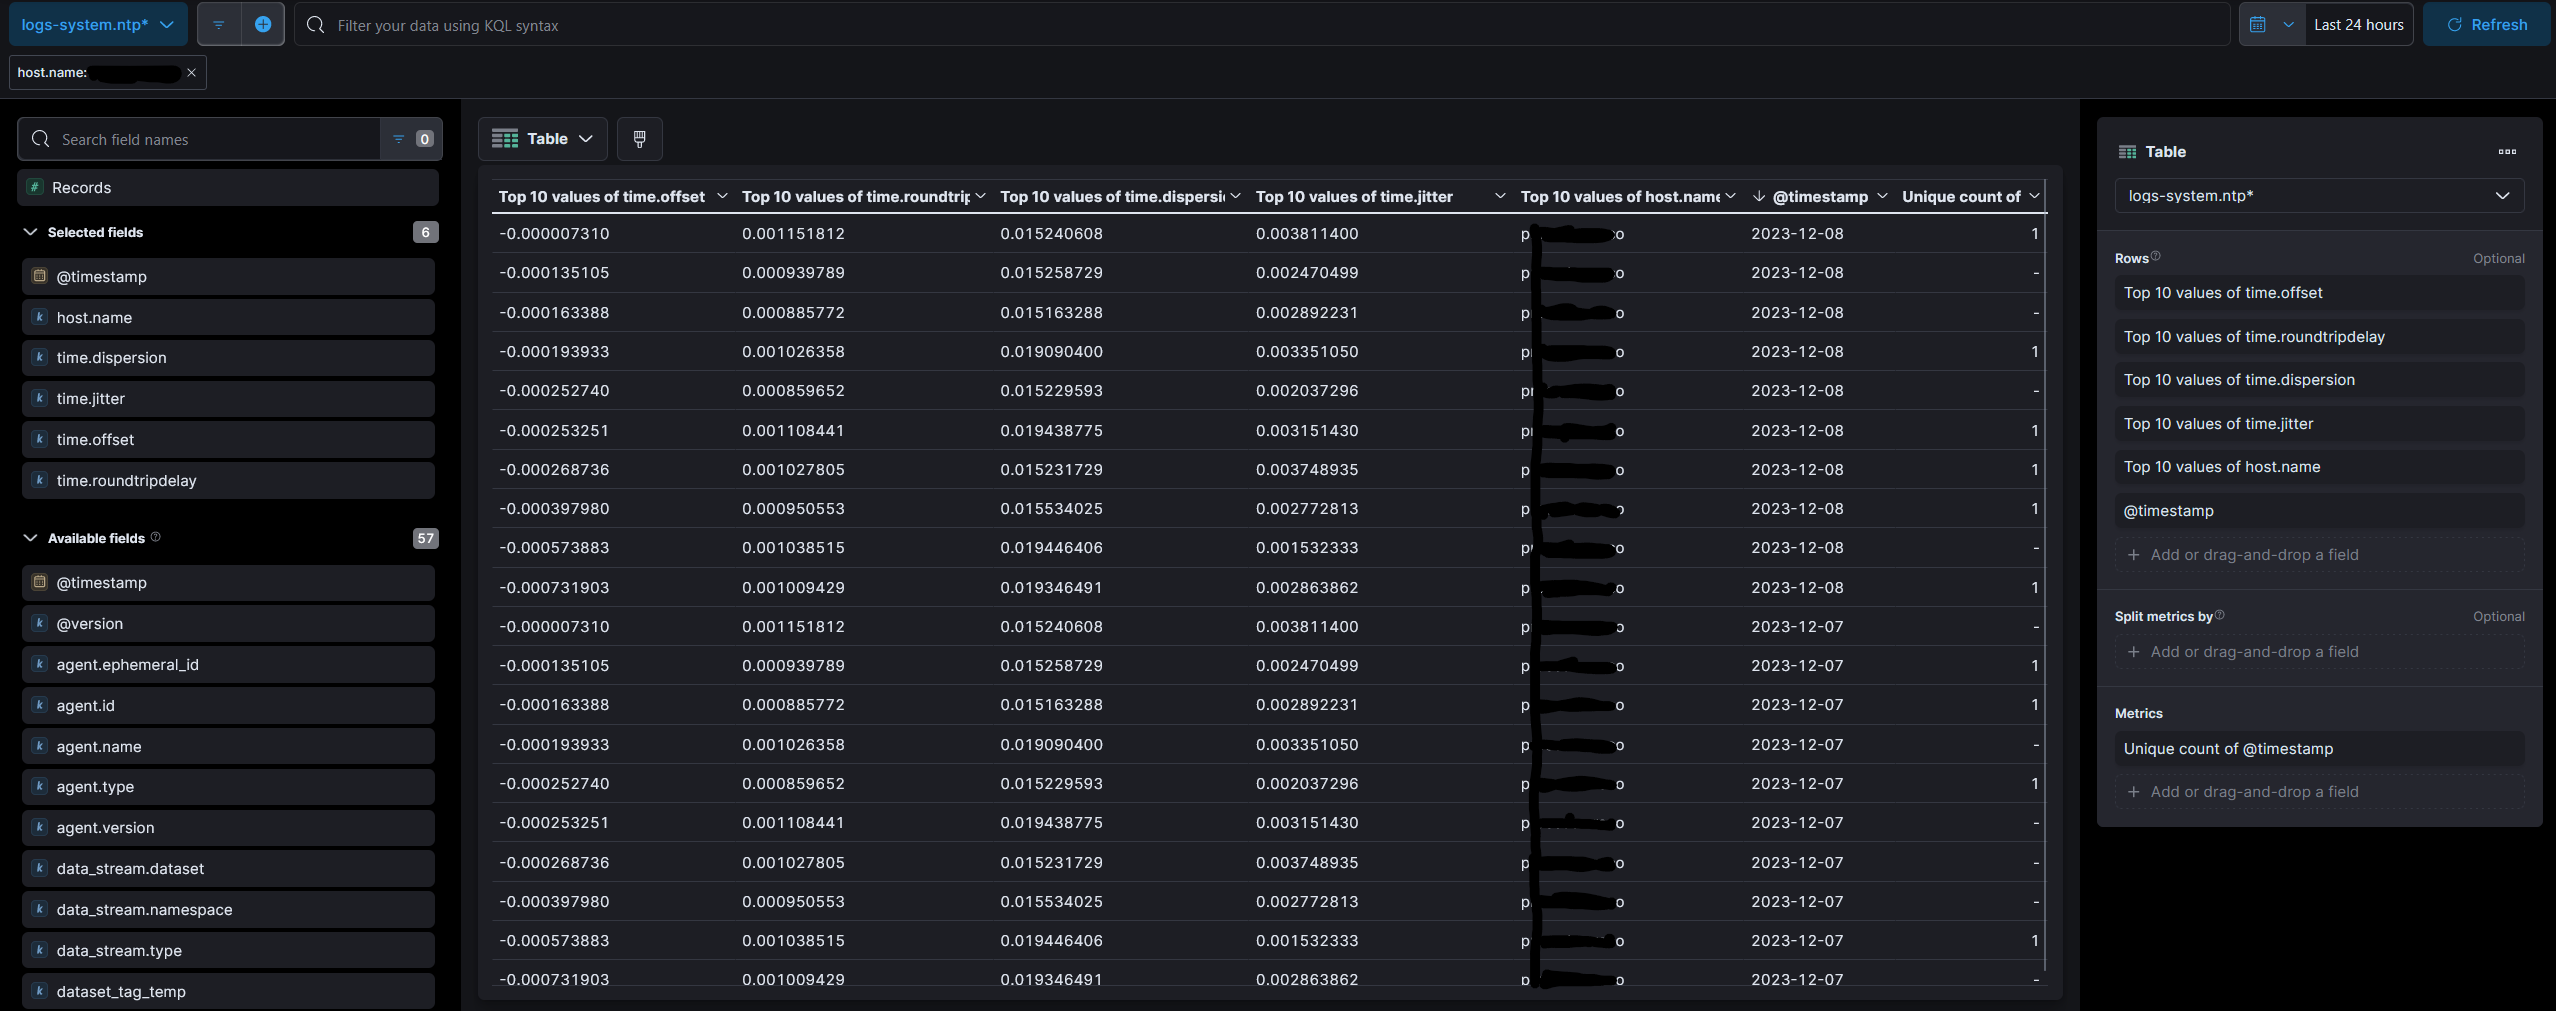
Now, you are showing TOP10 values for that day. For example: for the day 2023-12-08 there will be 10 entries for that day. Maybe if you show average values for the day you then will have one entry per day.
I am not sure what you mean by aggregate by timestamp, could you clarify that for me please? I split the metrics by minimum value of timestamp, and I'm getting closer to what I want but not exactly. Also changed the number of values being shown from 10 to 2.
I want the dates to be in one single column.
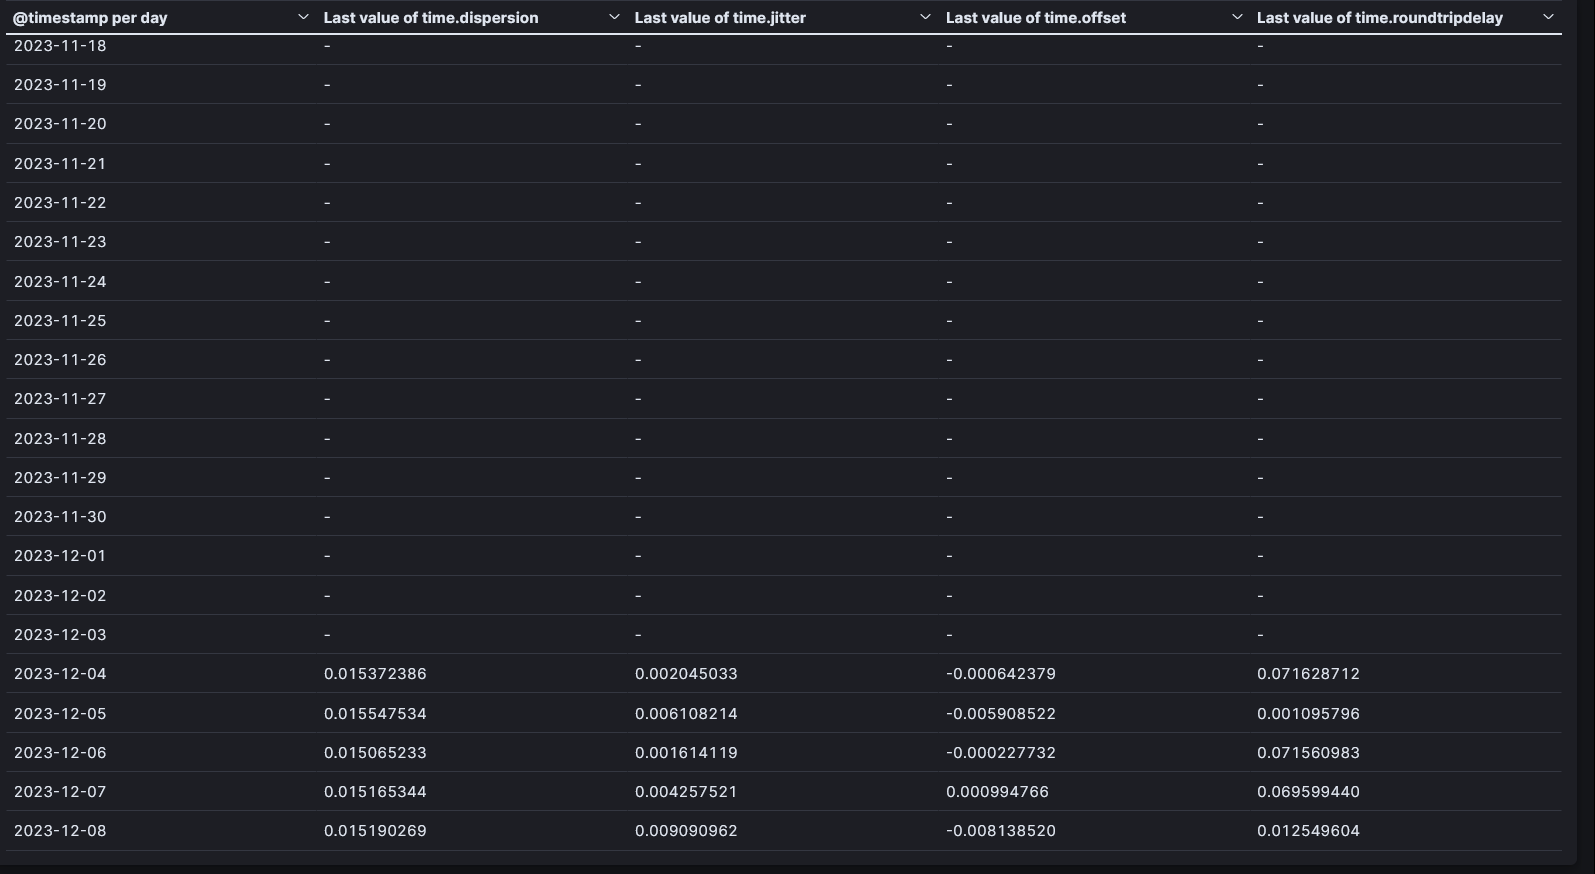
Ok I've managed to get it to look the way I want it to.
However, I noticed that the values are all the same in their respective categories across all dates. How can I make it use the exact value from the document? I see that the values are different in the documents.
It seems that it's taking the top value in that date range and using it for every row. If I change the date range to last 4 days the values change, same if I change it to the last 7 days too.
Did you select DateHistogram and marked Customize time interval and setted it to 1 day? When you tried to put the @timestamp field in the row?
Now try to check if your query interval range is big enough to get the data
© 2020. All Rights Reserved - Elasticsearch
Apache, Apache Lucene, Apache Hadoop, Hadoop, HDFS and the yellow elephant logo are trademarks of the Apache Software Foundation in the United States and/or other countries.