Setup: Server - installed ELK(elastic, Logstash and Kibana version-6.2.4)
Client- filebeat-6.2.4 log server
configured file beat such a way that, it will read log files from a specified directory and ship it to logstash for parsing.
In logstash parsing the data and creating index patterns.
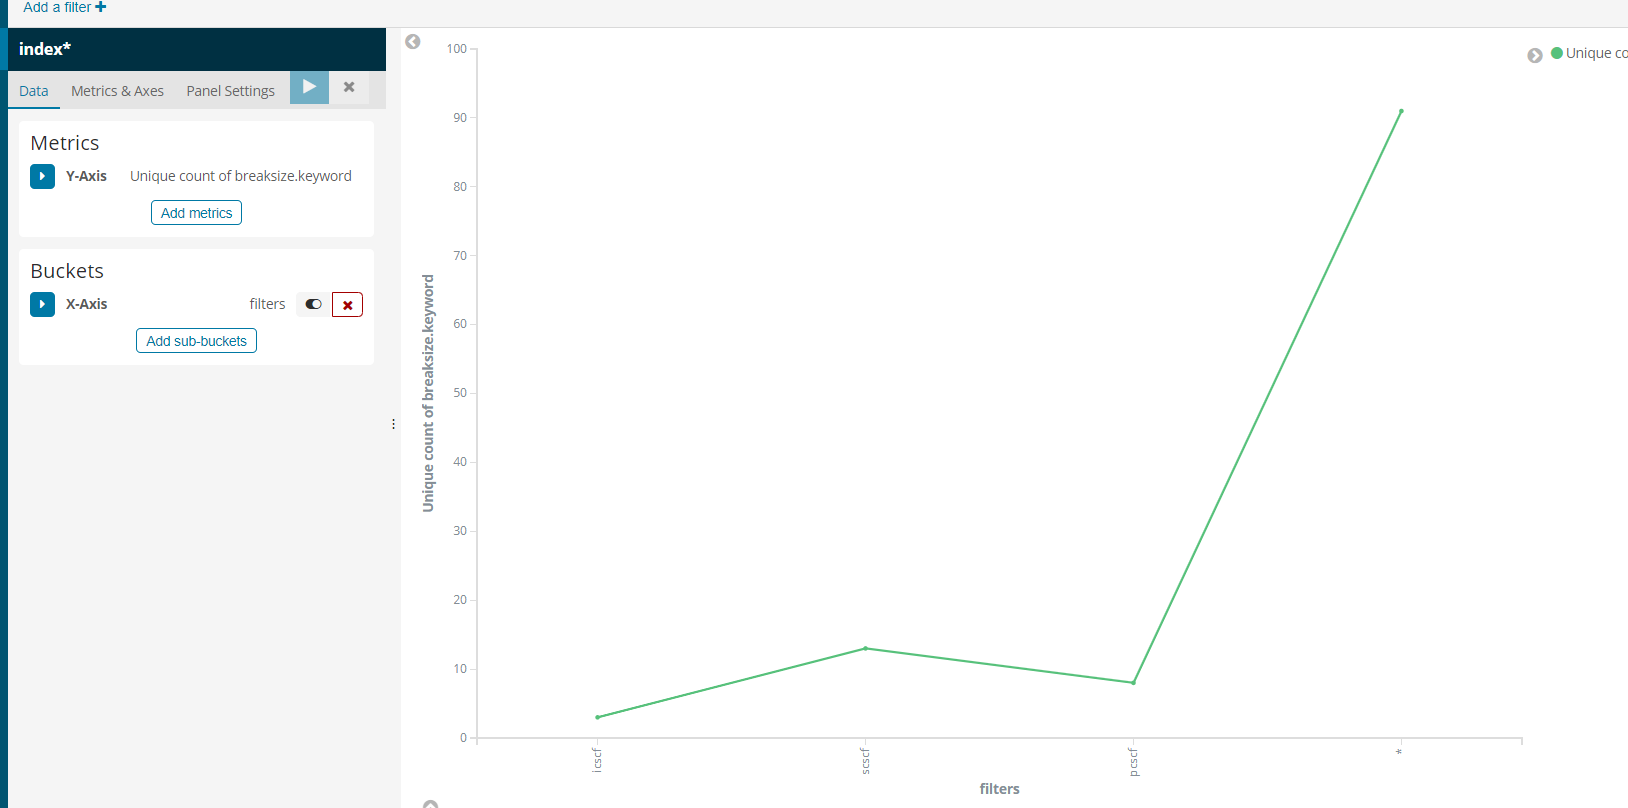
In kibana creating index patterns from elastic search data, and plotting visualisation graph as below.
Now i am stuck at below point, really appreciate some help!.
Is there any way to update to the same index name when new log files are scanned and index pattern created with same name?
for example: elasticsearch
{
hosts => ["http://x.x.x.x:9200"]
index => "index1"/"index2"/.. so on
}
I create index name as index1, index2 .. so on, and in kibana i will create index pattern name as index* to match any index1..n name, will this solve the problem?
like if i plot a graph with index name index* and generate one more index from logstash after refresh will the new data gets reflected in graph?, i tried this currently not working or am i missing something?
what i want to achieve is, i will create the dashboard which contains different visualisation graphs and later i want this graphs in dashboard needs to be updated as in when modified data parsed.
Yep, that's exactly how index patterns work. If your visualization is based on an index pattern called index* it'll always reflect data from all indices starting with index.
If you're not seeing the data you expect, you could grab the raw Elasticsearch query Kibana is sending from the network tab of your browser's dev tools. I would take the query and play with it in the Console application in Kibana to see why it's not returning the data you expect.
above is the indexed data, i want to plot a vertical line graph keeping fields as below.
X axis: process name
Y axis: argument_val problem here is i wanted the filed name breaksize for aggregation "max", at present i can see only @timestamp and offset as options.
breaksize is likely not mapped as a numeric type in all of your Elasticsearch index mappings. Check the field type in Kibana's index pattern management screen. If it says something other than number you'll need to check your Elasticsearch indices and make sure break size is mapped as a numeric type everywhere. Once you've fixed the mappings you'll have to refresh Kibana's field list by clicking the refresh button on the index pattern management screen.
this is how i am mapping the raw data from log files and converting them to numeric(INT) , please correct me if i am wrong here.
and after creating index pattern in kibana, i could see breaksize filed as below
thanks in advance.
Even tried with below filter, still the breaksize is not coming under numeric.
Apache, Apache Lucene, Apache Hadoop, Hadoop, HDFS and the yellow elephant
logo are trademarks of the
Apache Software Foundation
in the United States and/or other countries.