Hi,
I'm trying to figure out the number of user logins in certain instance. The reason being is I want to see how many users have logged in to instance ABC and who are the users logged in to instance ABC.
Thank you.
Hi,
I'm trying to figure out the number of user logins in certain instance. The reason being is I want to see how many users have logged in to instance ABC and who are the users logged in to instance ABC.
Thank you.
Can you give me a bit more information?
First, are you talking about user login events from your application or user login event in Kibana?
Second, are these events logged in Elasticsearch? if so can you see them at least in Kibana Discover?
If so, the answer is easy: open the navigation menu, go to visualize, Create visualization, Lens and from there drag and drop the first field on the right field list called "Records" to the chart. This will create a time series chart that counts the number of events you have ingested. Second you need to add a filter to the top bar to filter only the events related to a login (you will probably have ingested your events with some tag that specify if this is a login/logout etc event).
This is a basic explanation but I can give more guidance if you can describe better your current situation and system status
Hi Marco,
To answer your questions:
First, are you talking about user login events from your application or user login event in Kibana?
Second, are these events logged in Elasticsearch? if so can you see them at least in Kibana Discover?
"therest": "User 'xxxx' logged in with concurrent ALM"
"hostname": "SL-yyyyy"
I'm not sure if these currents fields are sufficient to create Visualization. Basically I just wanna see how many users have logged into certain instance for example weekly or monthly just to see the pattern of login frequencies.
Thank you.
This is definitely doable.
By opening following this guide Create visualizations with Lens | Kibana Guide [8.9] | Elastic you can definitely have an idea on how to operate in Lens and start displaying your data.
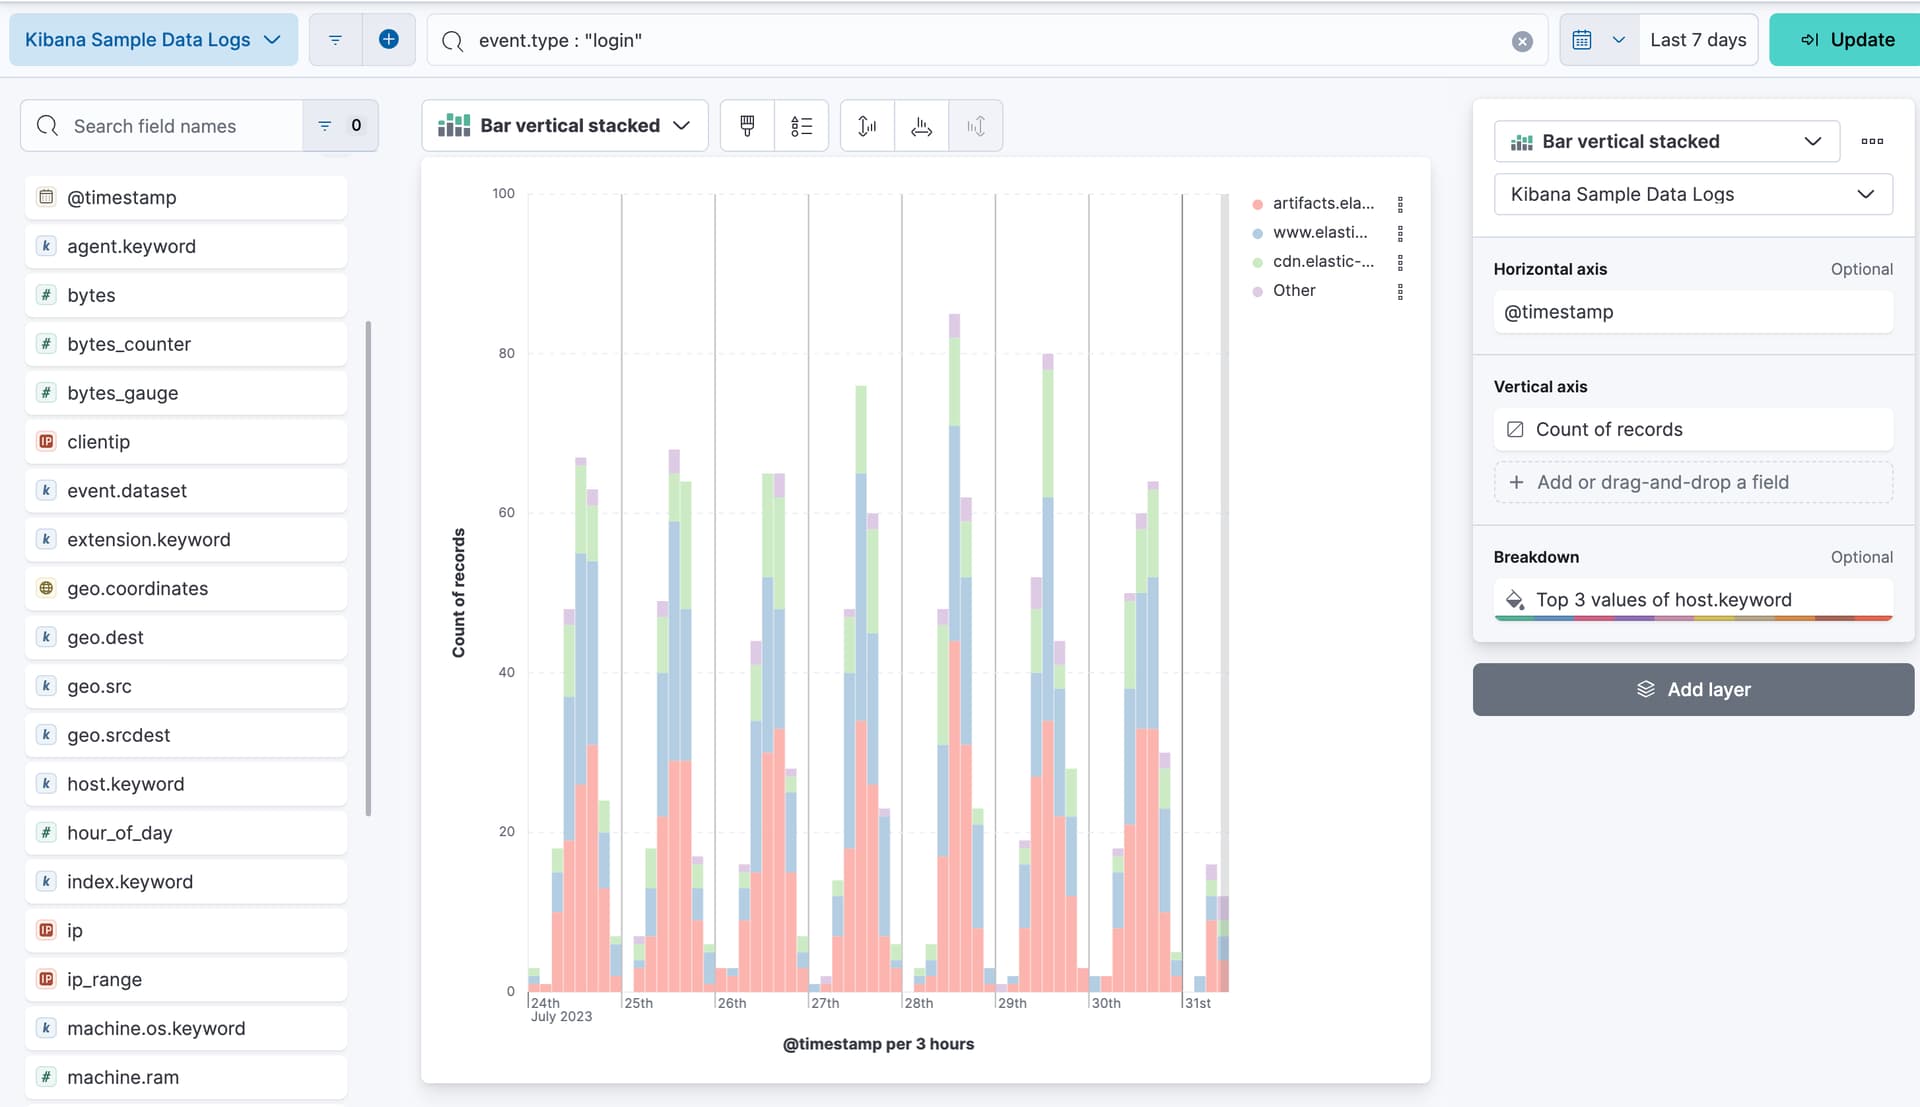
Initially you can just Open Lens, and drag a timestamp field to the chart area. This will display the overall count of document (related to the index/dataview shown in the top left dropdown menu) ingested in ES. if you wan to narrow this down to only documents related to your user logged, you should add a filter/query in the query bar that specify the field and the value that describe a login event. That way you are visualizing count of login events on your time frame.
Finally if you also drag the hostname field to the breakdown panel to the right, you will see a set of series per each host with the count of login events in your time frame.
I hope this helps
© 2020. All Rights Reserved - Elasticsearch
Apache, Apache Lucene, Apache Hadoop, Hadoop, HDFS and the yellow elephant logo are trademarks of the Apache Software Foundation in the United States and/or other countries.