Hello everyone,
I just freshly installed an Elastic stack on Kubernetes in following tutorial:
https://www.elastic.co/guide/en/cloud-on-k8s/current/index.html
So I have an elasticsearch cluster of two nodes (test phase;)) + an instance of Kibana that connects to it.
Everything seems to work because everything is in a "green" state:
-
Elasticsearch
kubectl get elasticsearch NAME HEALTH NODES VERSION PHASE AGE cloud green 2 7.1.0 Operational 4h -
Kibana
 kubectl get kibana

 NAME    HEALTH   NODES   VERSION   AGE
 cloud   green    1       7.1.0     4h
I can contact the ES API by filling in the access account (* data has been changed for security reasons *):
curl -u "elastic:pass" https://es.cloud.example.com
{
  "name" : "cloud-es-f2gqfdlsp6",
  "cluster_name" : "cloud",
  "cluster_uuid" : "rHnRmGsWSvyS14rGIyWq3w",
  "version" : {
    "number" : "7.1.0",
    "build_flavor" : "default",
    "build_type" : "docker",
    "build_hash" : "606a173",
    "build_date" : "2019-05-16T00:43:15.323135Z",
    "build_snapshot" : false,
    "lucene_version" : "8.0.0",
    "minimum_wire_compatibility_version" : "6.8.0",
    "minimum_index_compatibility_version" : "6.0.0-beta1"
  },
  "tagline" : "You Know, for Search"
}
I can connect to Kibana with the dedicated account and no errors appear.
I deployed filebeat and metricbeat on my k8s cluster and made sure they send their data to my elastic cluster.
This seems to be happening because I do not see any error in the logs and the indices are correctly created in ES:
curl -u "elastic:pass" https://es.cloud.example.com_cat/indices

green open kibana_sample_data_logs            IH22ll_MSEKOMSjNKTN5Lg 1 1    14005     0  21.9mb    11mb
green open .monitoring-es-7-2019.06.03        S5B1_mBrQtCAKxM4ca98Hw 1 1    23617 28468  31.9mb  15.7mb
green open .kibana_1                          2Y427ZARRG6ktI8Z6ePMBg 1 1        0     0    566b    283b
green open metricbeat-7.1.1-2019.06.03-000001 0lIhb99UQ1mf-0ryyk5XTQ 1 1   134396     0 140.3mb  70.3mb
green open .monitoring-kibana-7-2019.06.03    JdWb-TiFROCjfedvrXLN4g 1 1     1676     0   1.1mb 534.5kb
green open .kibana_task_manager               idILcj5mRHOtsYoGhNWxRA 1 1        2     0  74.9kb  45.5kb
green open .kibana                            0qrECl53RcqAoGG2nlLjIg 1 1       30     6   1.2mb 647.8kb
green open .security-7                        5HaugK0CQOauG2CFN6B_Iw 1 1        5     0  80.4kb  40.2kb
green open .kibana_2                          ert8jPjeTHGIhi0S3rb9mw 1 1        0     0    566b    283b
green open filebeat-7.1.1-2019.06.03-000001   DzD2Q4qjQUiV4kDuO4k7ig 1 1 12159278     0  12.4gb   5.5gb
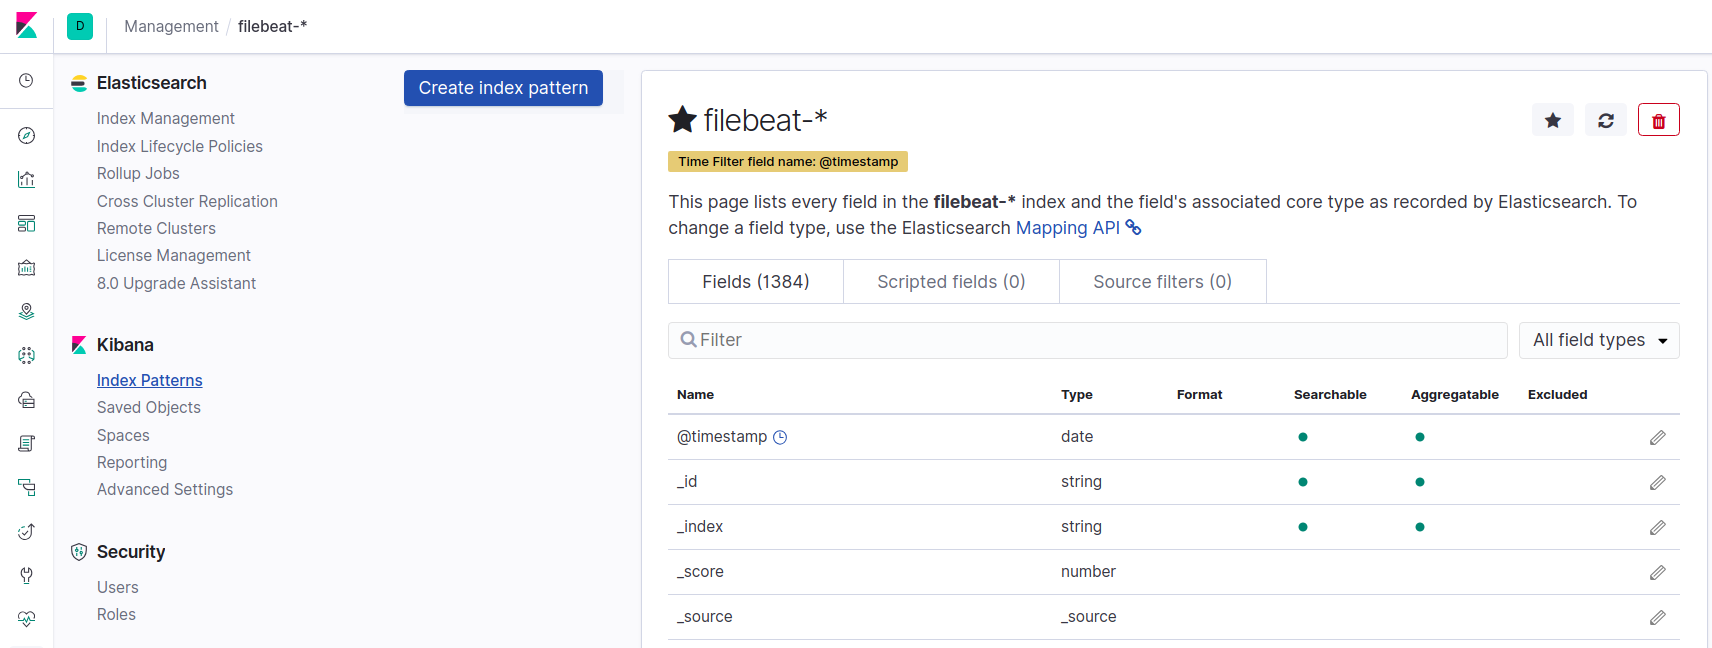
I wish now to be able to discover these indices in kibana by creating index patterns (ex: filebeat- *).
So I'm the classic procedure that seems to work:


The index pattern seems created, however when I click on the tab discover, it returns me to the menu of creation of the index pattern:

It does not seem to find this index pattern previously created.
However, when I go to the tabs "infrastucture" and "logs", the contents of the indexes are displayed:

If I open the chrome admin console, I can see the following message:

Any ideas ?
Benjamin

