[INFO ] 2018-08-30 10:21:32.130 [Ruby-0-Thread-5: C:/Program Files/Elastic/logst
ash-6.4.0/logstash-6.4.0/vendor/bundle/jruby/2.3.0/gems/logstash-output-elastics
earch-9.2.0-java/lib/logstash/outputs/elasticsearch/common.rb:42] elasticsearch
- Attempting to install template {:manage_template=>{"template"=>"logstash-*", "
version"=>60001, "settings"=>{"index.refresh_interval"=>"5s"}, "mappings"=>{"_de
fault_"=>{"dynamic_templates"=>[{"message_field"=>{"path_match"=>"message", "mat
ch_mapping_type"=>"string", "mapping"=>{"type"=>"text", "norms"=>false}}}, {"str
ing_fields"=>{"match"=>"*", "match_mapping_type"=>"string", "mapping"=>{"type"=>
"text", "norms"=>false, "fields"=>{"keyword"=>{"type"=>"keyword", "ignore_above"
=>256}}}}}], "properties"=>{"@timestamp"=>{"type"=>"date"}, "@version"=>{"type"=
>"keyword"}, "geoip"=>{"dynamic"=>true, "properties"=>{"ip"=>{"type"=>"ip"}, "lo
cation"=>{"type"=>"geo_point"}, "latitude"=>{"type"=>"half_float"}, "longitude"=
>{"type"=>"half_float"}}}}}}}}
[INFO ] 2018-08-30 10:21:34.926 [[main]-pipeline-manager] file - No sincedb_path
 set, generating one based on the "path" setting {:sincedb_path=>"C:/Program Fil
es/Elastic/logstash-6.4.0/logstash-6.4.0/data/plugins/inputs/file/.sincedb_10fb3
0483c7e9aeb5fb278e0c741c4cd", :path=>["C:\\inetpub\\logs\\LogFiles\\W3SVC1*/*.lo
g"]}
[INFO ] 2018-08-30 10:21:34.950 [Converge PipelineAction::Create<main>] pipeline
 - Pipeline started successfully {:pipeline_id=>"main", :thread=>"#<Thread:0xa0c
36b1e@C:/Program Files/Elastic/logstash-6.4.0/logstash-6.4.0/logstash-core/lib/l
ogstash/pipeline.rb:156 sleep>"}
[INFO ] 2018-08-30 10:21:34.961 [[main]<file] observingtail - START, creating Di
scoverer, Watch with file and sincedb collections
[INFO ] 2018-08-30 10:21:35.024 [Ruby-0-Thread-1: C:/Program Files/Elastic/logst
ash-6.4.0/logstash-6.4.0/vendor/bundle/jruby/2.3.0/gems/stud-0.0.23/lib/stud/tas
k.rb:22] agent - Pipelines running {:count=>1, :running_pipelines=>[:main], :non################################################################
## This file was built with the help of this tutorial:
## https://adammills.wordpress.com/2014/02/21/logstash-and-iis/
##
## The full logstash docs are here: http://logstash.net/docs/1.4.2/
#
## We have IIS configured to use a single log file for all sites
# because logstash can't handle parsing files in different
# directories if they have the same name.
#
input {
file {
type => "iis-w3c"
path => "C:\inetpub\logs\LogFiles\W3SVC1*/*.log"
}
}
filter {
## Ignore the comments that IIS will add to the start of the W3C logs
#
if [message] =~ "^#" {
drop {}
}
grok {
## Very helpful site for building these statements:
# http://grokdebug.herokuapp.com/
#
# This is configured to parse out every field of IIS's W3C format when
# every field is included in the logs
#
match => ["message", "%{TIMESTAMP_ISO8601:log_timestamp} %{WORD:serviceName} %{WORD:serverName} %{IP:serverIP} %{WORD:method} %{URIPATH:uriStem} %{NOTSPACE:uriQuery} %{NUMBER:port} %{NOTSPACE:username} %{IPORHOST:clientIP} %{NOTSPACE:protocolVersion} %{NOTSPACE:userAgent} %{NOTSPACE:cookie} %{NOTSPACE:referer} %{NOTSPACE:requestHost} %{NUMBER:response} %{NUMBER:subresponse} %{NUMBER:win32response} %{NUMBER:bytesSent} %{NUMBER:bytesReceived} %{NUMBER:timetaken}"]
}
## Set the Event Timesteamp from the log
#
date {
match => [ "log_timestamp", "YYYY-MM-dd HH:mm:ss" ]
timezone => "Etc/UTC"
}
## If the log record has a value for 'bytesSent', then add a new field
# to the event that converts it to kilobytes
#
if [bytesSent] {
ruby {
code => "event['kilobytesSent'] = event['bytesSent'].to_i / 1024.0"
}
}
## Do the same conversion for the bytes received value
#
if [bytesReceived] {
ruby {
code => "event['kilobytesReceived'] = event['bytesReceived'].to_i / 1024.0"
}
}
## Perform some mutations on the records to prep them for Elastic
#
mutate {
## Convert some fields from strings to integers
#
convert => ["bytesSent", "integer"]
convert => ["bytesReceived", "integer"]
convert => ["timetaken", "integer"]
## Create a new field for the reverse DNS lookup below
#
add_field => { "clientHostname" => "%{clientIP}" }
## Finally remove the original log_timestamp field since the event will
# have the proper date on it
#
remove_field => [ "log_timestamp"]
}
## Do a reverse lookup on the client IP to get their hostname.
#
dns {
## Now that we've copied the clientIP into a new field we can
# simply replace it here using a reverse lookup
#
action => "replace"
reverse => ["clientHostname"]
}
## Parse out the user agent
#
useragent {
source=> "useragent"
prefix=> "browser"
}
}
## We're only going to output these records to Elasticsearch so configure
# that.
#
output {
elasticsearch {
#embedded => false
hosts => "localhost:9200"
#port => 9200
#protocol => "http"
#
## Log records into month-based indexes
#
index => "%{type}-%{+YYYY.MM}"
}
## stdout included just for testing
#
stdout {codec => rubydebug}
}That tutorial is over 4 years old and uses out-of-date versions of Logstash and Elasticsearch. If your logs are in standard format, have you tried using the Filebeat IIS module? If you want to continue using Logstash, I would recommend this getting started guide. Once you are building the pipeline you should be able to use the grok expressions in the tutorial you referenced, although it will not work straight out of the box in all places.
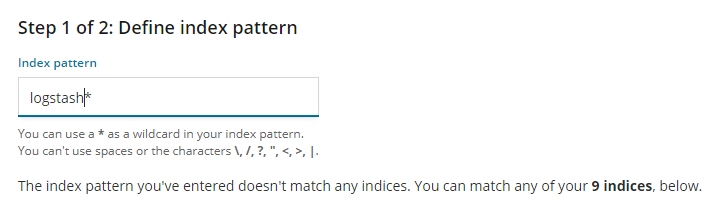
@Christian_Dahlqvist I have followed the link you mentioned in your comment but unable to index logstash in kibana plz reply what is wrong with the code
Please show your current configuration that you created based on the links I provided.
input {
#beats {
#    port => "9601"
#}
 file {
 type => "iis-w3c"
 path => "C:\inetpub\logs\LogFiles\W3SVC1*/*.log"
 sincedb_path => "/dev/null"
 start_position => "beginning"
  }
}

# The filter part of this file is commented out to indicate that it is
# optional.
# filter {
#
# }

setup.kibana:
  host: "localhost:5601"

output {
  elasticsearch {
#embedded => false
hosts => "localhost:9200"
#port => 9200
#protocol => "http"
#
## Log records into month-based indexes
#
index => "logstash-%{[beat.version]}-%{+yyyy.MM.dd}"

  }

  ## stdout included just for testing
  #
  stdout {codec => rubydebug}
}#Fields: date time s-sitename s-computername s-ip cs-method cs-uri-stem cs-uri-query s-port cs-username c-ip cs-version cs(User-Agent) cs(Cookie) cs(Referer) cs-host sc-status sc-substatus sc-win32-status sc-bytes cs-bytes time-taken
This is the IIS logs format which I want to parse using logstash and send to elasticsearch and show on UI using kibana, but kibana don't index the file, and how would i know that after parsing the file is pushed to elasticsearch.
What is this doing in the Logstash config?
As you are now using a file input, this parameter will not be set.
Where are your filters?
What output do you get here?
C:\Program Files\Elastic\logstash-6.4.0\logstash-6.4.0\bin>logstash -f logstash-
simple.conf
Sending Logstash logs to C:/Program Files/Elastic/logstash-6.4.0/logstash-6.4.0/
logs which is now configured via log4j2.properties
[2018-08-30T20:25:12,304][WARN ][logstash.config.source.multilocal] Ignoring the
 'pipelines.yml' file because modules or command line options are specified
[2018-08-30T20:25:13,191][INFO ][logstash.runner          ] Starting Logstash {"
logstash.version"=>"6.4.0"}
[2018-08-30T20:25:13,265][ERROR][logstash.config.sourceloader] Could not fetch a
ll the sources {:exception=>LogStash::ConfigLoadingError, :message=>"The followi
ng config files contains non-ascii characters but are not UTF-8 encoded [\"C:/Pr
ogram Files/Elastic/logstash-6.4.0/logstash-6.4.0/bin/logstash-simple.conf\"]",
:backtrace=>["C:/Program Files/Elastic/logstash-6.4.0/logstash-6.4.0/logstash-co
re/lib/logstash/config/source/local.rb:83:in `read'", "C:/Program Files/Elastic/
logstash-6.4.0/logstash-6.4.0/logstash-core/lib/logstash/config/source/local.rb:
94:in `read'", "C:/Program Files/Elastic/logstash-6.4.0/logstash-6.4.0/logstash-
core/lib/logstash/config/source/local.rb:190:in `local_pipeline_configs'", "C:/P
rogram Files/Elastic/logstash-6.4.0/logstash-6.4.0/logstash-core/lib/logstash/co
nfig/source/local.rb:161:in `pipeline_configs'", "C:/Program Files/Elastic/logst
ash-6.4.0/logstash-6.4.0/logstash-core/lib/logstash/config/source_loader.rb:61:i
n `block in fetch'", "org/jruby/RubyArray.java:2481:in `collect'", "C:/Program F
iles/Elastic/logstash-6.4.0/logstash-6.4.0/logstash-core/lib/logstash/config/sou
rce_loader.rb:60:in `fetch'", "C:/Program Files/Elastic/logstash-6.4.0/logstash-
6.4.0/logstash-core/lib/logstash/agent.rb:142:in `converge_state_and_update'", "
C:/Program Files/Elastic/logstash-6.4.0/logstash-6.4.0/logstash-core/lib/logstas
h/agent.rb:93:in `execute'", "C:/Program Files/Elastic/logstash-6.4.0/logstash-6
.4.0/logstash-core/lib/logstash/runner.rb:362:in `block in execute'", "C:/Progra
m Files/Elastic/logstash-6.4.0/logstash-6.4.0/vendor/bundle/jruby/2.3.0/gems/stu
d-0.0.23/lib/stud/task.rb:24:in `block in initialize'"]}
[2018-08-30T20:25:13,276][ERROR][logstash.agent           ] An exception happene
d when converging configuration {:exception=>RuntimeError, :message=>"Could not
fetch the configuration, message: The following config files contains non-ascii
characters but are not UTF-8 encoded [\"C:/Program Files/Elastic/logstash-6.4.0/
logstash-6.4.0/bin/logstash-simple.conf\"]", :backtrace=>["C:/Program Files/Elas
tic/logstash-6.4.0/logstash-6.4.0/logstash-core/lib/logstash/agent.rb:149:in `co
nverge_state_and_update'", "C:/Program Files/Elastic/logstash-6.4.0/logstash-6.4
.0/logstash-core/lib/logstash/agent.rb:93:in `execute'", "C:/Program Files/Elast
ic/logstash-6.4.0/logstash-6.4.0/logstash-core/lib/logstash/runner.rb:362:in `bl
ock in execute'", "C:/Program Files/Elastic/logstash-6.4.0/logstash-6.4.0/vendor
/bundle/jruby/2.3.0/gems/stud-0.0.23/lib/stud/task.rb:24:in `block in initialize
'"]}
[2018-08-30T20:25:13,675][INFO ][logstash.agent           ] Successfully started
Logstash API endpoint {:port=>9600}#I have change the logstash config file
input {
#beats {
# port => "9601"
#}
file {
type => "iis-w3c"
path => "C:\inetpub\logs\LogFiles\W3SVC1*/*.log"
sincedb_path => "/dev/null"
start_position => "beginning"
}
}
# The filter part of this file is commented out to indicate that it is
# optional.
filter {
dissect {
mapping => {
"message" => "%{date} %{time} %{s-sitename} %{s-computername} %{s-ip} %{cs-method} %{cs-uri-stem}/%{cs-uri-query} %{s-port} %{cs-username} %{c-ip} %{cs-version} %{cs(User-Agent)} %{cs(Cookie)} %{cs(Referer)} %{cs-host} %{sc-status} %{sc-substatus} %{sc-win32-status} %{sc-bytes} %{cs-bytes} %{time-taken}"
}
remove_field => [“message”]
}
}
output {
elasticsearch {
#embedded => false
hosts => "localhost:9200"
#port => 9200
#protocol => "http"
#
## Log records into month-based indexes
}
## stdout included just for testing
#
stdout {codec => rubydebug}
}What does this config give when you look at the output to stdout?
I have pasted the stuff above config file the cmd text
[ERROR][logstash.config.sourceloader] Could not fetch a ll the sources {:exception=>LogStash::ConfigLoadingError, :message=>"The followi ng config files contains non-ascii characters but are not UTF-8 encoded [\"C:/Pr ogram Files/Elastic/logstash-6.4.0/logstash-6.4.0/bin/logstash-simple.conf\"]",
Looks like you need to clean up the config file as you have some illegal characters in it.
how to clean up the config file
Open it in a suitable editor and remove unnecessary parts. Remove any non-ascii characters. I do not use Windows, so can not give suggestions about best editor to use.

C:\Program Files\Elastic\logstash-6.4.0\logstash-6.4.0\bin>logstash -f logstash-
simple.conf --config.reload.automatic
Sending Logstash logs to C:/Program Files/Elastic/logstash-6.4.0/logstash-6.4.0/
logs which is now configured via log4j2.properties
[2018-08-31T14:24:45,886][WARN ][logstash.config.source.multilocal] Ignoring the
 'pipelines.yml' file because modules or command line options are specified
[2018-08-31T14:24:47,025][INFO ][logstash.runner          ] Starting Logstash {"
logstash.version"=>"6.4.0"}
[2018-08-31T14:24:51,814][INFO ][logstash.pipeline        ] Starting pipeline {:
pipeline_id=>"main", "pipeline.workers"=>4, "pipeline.batch.size"=>125, "pipelin
e.batch.delay"=>50}
[2018-08-31T14:24:52,639][INFO ][logstash.outputs.elasticsearch] Elasticsearch p
ool URLs updated {:changes=>{:removed=>[], :added=>[http://localhost:9200/]}}
[2018-08-31T14:24:52,657][INFO ][logstash.outputs.elasticsearch] Running health
check to see if an Elasticsearch connection is working {:healthcheck_url=>http:/
/localhost:9200/, :path=>"/"}
[2018-08-31T14:24:53,043][WARN ][logstash.outputs.elasticsearch] Restored connec
tion to ES instance {:url=>"http://localhost:9200/"}
[2018-08-31T14:24:53,149][INFO ][logstash.outputs.elasticsearch] ES Output versi
on determined {:es_version=>6}
[2018-08-31T14:24:53,156][WARN ][logstash.outputs.elasticsearch] Detected a 6.x
and above cluster: the `type` event field won't be used to determine the documen
t _type {:es_version=>6}
[2018-08-31T14:24:53,208][INFO ][logstash.outputs.elasticsearch] New Elasticsear
ch output {:class=>"LogStash::Outputs::ElasticSearch", :hosts=>["//localhost:920
0"]}
[2018-08-31T14:24:53,234][INFO ][logstash.outputs.elasticsearch] Using mapping t
emplate from {:path=>nil}
[2018-08-31T14:24:53,264][INFO ][logstash.outputs.elasticsearch] Attempting to i
nstall template {:manage_template=>{"template"=>"logstash-*", "version"=>60001,
"settings"=>{"index.refresh_interval"=>"5s"}, "mappings"=>{"_default_"=>{"dynami
c_templates"=>[{"message_field"=>{"path_match"=>"message", "match_mapping_type"=
>"string", "mapping"=>{"type"=>"text", "norms"=>false}}}, {"string_fields"=>{"ma
tch"=>"*", "match_mapping_type"=>"string", "mapping"=>{"type"=>"text", "norms"=>
false, "fields"=>{"keyword"=>{"type"=>"keyword", "ignore_above"=>256}}}}}], "pro
perties"=>{"@timestamp"=>{"type"=>"date"}, "@version"=>{"type"=>"keyword"}, "geo
ip"=>{"dynamic"=>true, "properties"=>{"ip"=>{"type"=>"ip"}, "location"=>{"type"=
>"geo_point"}, "latitude"=>{"type"=>"half_float"}, "longitude"=>{"type"=>"half_f
loat"}}}}}}}}
[2018-08-31T14:24:54,686][INFO ][logstash.inputs.file     ] No sincedb_path set,
 generating one based on the "path" setting {:sincedb_path=>"C:/Program Files/El
astic/logstash-6.4.0/logstash-6.4.0/data/plugins/inputs/file/.sincedb_67380ed2d8
f37899e4bb6ce9a8d15c94", :path=>["C:\\inetpub\\logs\\LogFiles\\*\\*"]}
[2018-08-31T14:24:55,071][INFO ][logstash.pipeline        ] Pipeline started suc
cessfully {:pipeline_id=>"main", :thread=>"#<Thread:0x22f9066f run>"}
[2018-08-31T14:24:55,177][INFO ][logstash.agent           ] Pipelines running {:
count=>1, :running_pipelines=>[:main], :non_running_pipelines=>[]}
[2018-08-31T14:24:55,178][INFO ][filewatch.observingtail  ] START, creating Disc
overer, Watch with file and sincedb collections
[2018-08-31T14:24:55,852][INFO ][logstash.agent           ] Successfully started
Logstash API endpoint {:port=>9600}@Christian_Dahlqvist
I have cleaned th config file what should I do next the result is not shown in the cmdconsole