ILM policy not applied

Hello, I have an indice that does not follow the applied lifecycle policy. Other indexes for the indice are rotating correctly.

  • The current size of the index is over 230 GB for the primary shard.

Here is the ILM configuration:

{
  "policy": "logstash-policy",
  "phase_definition": {
    "min_age": "0ms",
    "actions": {
      "rollover": {
        "max_age": "30d",
        "max_primary_shard_docs": 200000000,
        "min_docs": 1,
        "max_primary_shard_size": "50gb"
      }
    }
  },
  "version": 4,
  "modified_date_in_millis": 1622398401153
}

  • Input to the index is via filebeat --> Logstash --> Elasticsearch. Here are their configurations.

Filebeat:
Elasticsearc Temples

setup.template.settings:
  index.number_of_shards: 1
  index.codec: best_compression

Output

output.logstash:
  # The Logstash hosts
  hosts: ["host1:5054","host2:4054"]

Logstash:

output {
    if [type] == "cowrie" {
        elasticsearch {
            hosts => ["https://ip1:9200","https://ip2:9200"]
            #data_stream => true  #Causes Errors: added after reading this: https://www.elastic.co/guide/en/logstash/current/plugins-outputs-elasticsearch.html#plugins-outputs-elasticsearch-data_streamwhile diagnosing cowrie ingestion causing data duplication.
            index => "cowrie-logstash-%{+yyyy.MM.dd}"
            ssl => true
            user => ''
            password => ''
            cacert => '/etc/logstash/elasticsearch-ca.pem'
            ssl_certificate_verification => full
            ilm_enabled => auto
            ilm_rollover_alias => "cowrie-logstash"
        }

How do I:

  1. Why is this happening?
  2. Apply the policy to rotate the index at 50GB or annually.
  3. Break this into 4 indexes of 40 GB each.

Thank you very much.

Thanks for reaching out, @parthmaniar.

There are a few similar forum posts that might be helpful to reference:

Also this troubleshooting guide may also be a good starting point too.

Thank you very much @jessgarson. I apologise for this thread being a repeat. I hope my diagnosis provides steps for the next person (as opposed to the generic page, which is helpful, too.)

The following outputs are from Postman (you could use Kibana too)

  1. ILM status is working:

query

https://IP:9200/_ilm/status

response

WORKING

Here is the policy and its implication for the index.

input

https://IP:9200/cowrie-logstash-2021.12.30-000018/_ilm/explain

output

{
    "indices": {
        "cowrie-logstash-2021.12.30-000018": {
            "index": "cowrie-logstash-2021.12.30-000018",
            "managed": true,
            "policy": "logstash-policy",
            "index_creation_date_millis": 1640884225151,
            "time_since_index_creation": "878.68d",
            "lifecycle_date_millis": 1643743227492,
            "age": "845.59d",
            "phase": "hot",
            "phase_time_millis": 1643743203480,
            "action": "complete",
            "action_time_millis": 1643743240097,
            "step": "complete",
            "step_time_millis": 1643743240097,
            "phase_execution": {
                "policy": "logstash-policy",
                "phase_definition": {
                    "min_age": "0ms",
                    "actions": {
                        "rollover": {
                            "max_age": "30d",
                            "min_docs": 1,
                            "max_primary_shard_docs": 200000000,
                            "max_primary_shard_size": "50gb"
                        }
                    }
                },
                "version": 4,
                "modified_date_in_millis": 1622398401153
            }
        }
    }
}

When checking for index settings, I found that ILM was listed as "completed"

Input:

https://IP:9200/cowrie-logstash-2021.12.30-000018/_settings

Output

{
    "cowrie-logstash-2021.12.30-000018": {
        "settings": {
            "index": {
                "lifecycle": {
                    "name": "logstash-policy",
                    "rollover_alias": "cowrie-logstash",
                    "indexing_complete": "true"
                },
                "routing": {
                    "allocation": {
                        "include": {
                            "_tier_preference": "data_content"
                        }
                    }
                },
                "refresh_interval": "5s",
                "number_of_shards": "1",
                "provided_name": "<cowrie-logstash-{now/d}-000018>",
                "creation_date": "1640884225151",
                "number_of_replicas": "1",
                "uuid": "g5GyH1aFTpC9n8pEGA0dLg",
                "version": {
                    "created": "7160299"
                }
            }
        }
    }
}

I followed a crude approach of "reapplying" ILM settings based on this thread. I did this via Kibana by removing the ILM template to the index and applying it again.

However, the index is as is, and no tasks are pending on the cluster.

{
    "cluster_name": "data_analytics_1",
    "status": "green",
    "timed_out": false,
    "number_of_nodes": 3,
    "number_of_data_nodes": 2,
    "active_primary_shards": 1191,
    "active_shards": 2382,
    "relocating_shards": 0,
    "initializing_shards": 0,
    "unassigned_shards": 0,
    "delayed_unassigned_shards": 0,
    "number_of_pending_tasks": 0,
    "number_of_in_flight_fetch": 0,
    "task_max_waiting_in_queue_millis": 0,
    "active_shards_percent_as_number": 100.0
}

I will continue diagnosing and updating the thread. However, from the data provided, can anyone spot an error? Please do let me know.

PS:
Since the index does not have ILM errors, the retry call does not work.

Thanks for following up, @parthmaniar. I just wanted to check in here, are you still experiencing this issue?

If so, I have a few other follow up questions:

  • Have you taken a look at your rollover policy? I've seen a few cases where this was the issue.
  • What version of Elastic are you using?

Thanks!
Jessica

Hello @jessgarson, thank you very much for your reply. I couldn't find an additional pathway to continue diagnostics.

Please find the requested information:

  1. Cluster version is: 8.13.4

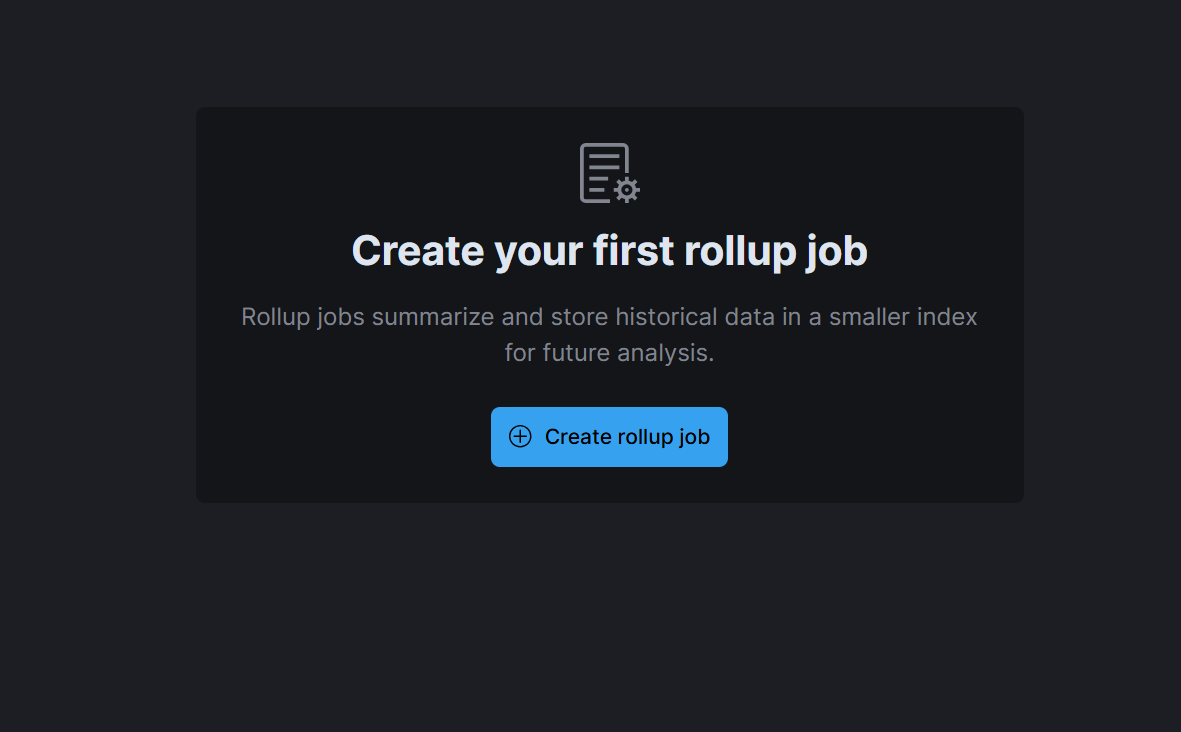
  2. I am unsure, and hence I apologise, but assuming you meant rollup jobs, I don't have any:

If you meant rollup policy, I couldn't find it in the ILM, but here is a print screen that may help.

I recall that a few .system or .hidden indexes were deleted as the cluster exceeded 1200 indexes. I am not sure if this caused it to break (but it was around two years ago when the ILM stopped working)

I did find one health API that provided "yellow" and output for ILMs. Unfortunately, the indexes in question aren't the ones that have any data being written to:

query

_health_report

Response

{
    "status": "yellow",
    "cluster_name": "data_analytics_1",
    "indicators": {
        "master_is_stable": {
            "status": "green",
            "symptom": "The cluster has a stable master node",
            "details": {
                "current_master": {
                    "node_id": "**REDACTED**",
                    "name": "primarynode"
                },
                "recent_masters": [
                    {
                        "node_id": "**REDACTED**",
                        "name": "primarynode"
                    }
                ]
            }
        },
        "repository_integrity": {
            "status": "green",
            "symptom": "All repositories are healthy.",
            "details": {
                "total_repositories": 1
            }
        },
        "disk": {
            "status": "green",
            "symptom": "The cluster has enough available disk space.",
            "details": {
                "indices_with_readonly_block": 0,
                "nodes_with_enough_disk_space": 3,
                "nodes_with_unknown_disk_status": 0,
                "nodes_over_high_watermark": 0,
                "nodes_over_flood_stage_watermark": 0
            }
        },
        "shards_capacity": {
            "status": "green",
            "symptom": "The cluster has enough room to add new shards.",
            "details": {
                "data": {
                    "max_shards_in_cluster": 2400
                },
                "frozen": {
                    "max_shards_in_cluster": 0
                }
            }
        },
        "shards_availability": {
            "status": "green",
            "symptom": "This cluster has all shards available.",
            "details": {
                "unassigned_replicas": 0,
                "started_primaries": 993,
                "restarting_primaries": 0,
                "initializing_primaries": 0,
                "creating_replicas": 0,
                "started_replicas": 993,
                "unassigned_primaries": 0,
                "restarting_replicas": 0,
                "creating_primaries": 0,
                "initializing_replicas": 0
            }
        },
        "data_stream_lifecycle": {
            "status": "green",
            "symptom": "Data streams are executing their lifecycles without issues",
            "details": {
                "stagnating_backing_indices_count": 0,
                "total_backing_indices_in_error": 0
            }
        },
        "slm": {
            "status": "green",
            "symptom": "Snapshot Lifecycle Management is running",
            "details": {
                "slm_status": "RUNNING",
                "policies": 1
            }
        },
        "ilm": {
            "status": "yellow",
            "symptom": "2 indices have stayed on the same action longer than expected.",
            "details": {
                "stagnating_indices_per_action": {
                    "allocate": 0,
                    "shrink": 0,
                    "searchable_snapshot": 0,
                    "rollover": 2,
                    "forcemerge": 0,
                    "delete": 0,
                    "migrate": 0
                },
                "policies": 55,
                "stagnating_indices": 2,
                "ilm_status": "RUNNING"
            },
            "impacts": [
                {
                    "id": "elasticsearch:health:ilm:impact:stagnating_index",
                    "severity": 3,
                    "description": "Automatic index lifecycle and data retention management cannot make progress on one or more indices. The performance and stability of the indices and/or the cluster could be impacted.",
                    "impact_areas": [
                        "deployment_management"
                    ]
                }
            ],
            "diagnosis": [
                {
                    "id": "elasticsearch:health:ilm:diagnosis:stagnating_action:rollover",
                    "cause": "Some indices have been stagnated on the action [rollover] longer than the expected time.",
                    "action": "Check the current status of the Index Lifecycle Management for every affected index using the [GET /<affected_index_name>/_ilm/explain] API. Please replace the <affected_index_name> in the API with the actual index name.",
                    "help_url": "https://ela.st/ilm-explain",
                    "affected_resources": {
                        "ilm_policies": [
                            "30-days-default",
                            "ml-size-based-ilm-policy"
                        ],
                        "indices": [
                            ".ml-state-000001",
                            "domains-ukraine-war-2022.04.23"
                        ]
                    }
                }
            ]
        }
    }
}

While I've posted this earlier, I will post the outputs for ILM Explain for the index that matters to me cowrie-logstash-2021.12.30-000018 and other two from the output above.

cowrie-logstash-2021.12.30-000018

{
    "indices": {
        "cowrie-logstash-2021.12.30-000018": {
            "index": "cowrie-logstash-2021.12.30-000018",
            "managed": true,
            "policy": "logstash-policy",
            "index_creation_date_millis": 1640884225151,
            "time_since_index_creation": "887.57d",
            "lifecycle_date_millis": 1643743227492,
            "age": "854.48d",
            "phase": "hot",
            "phase_time_millis": 1716803640221,
            "action": "complete",
            "action_time_millis": 1716804086388,
            "step": "complete",
            "step_time_millis": 1716804086388,
            "phase_execution": {
                "policy": "logstash-policy",
                "phase_definition": {
                    "min_age": "0ms",
                    "actions": {
                        "rollover": {
                            "max_age": "30d",
                            "min_docs": 1,
                            "max_primary_shard_docs": 200000000,
                            "max_primary_shard_size": "50gb"
                        }
                    }
                },
                "version": 4,
                "modified_date_in_millis": 1622398401153
            }
        }
    }
}

.ml-state-000001

{
    "indices": {
        ".ml-state-000001": {
            "index": ".ml-state-000001",
            "managed": true,
            "policy": "ml-size-based-ilm-policy",
            "index_creation_date_millis": 1620659565200,
            "time_since_index_creation": "1121.65d",
            "lifecycle_date_millis": 1620659565200,
            "age": "1121.65d",
            "phase": "hot",
            "phase_time_millis": 1659638235242,
            "action": "rollover",
            "action_time_millis": 1620659565631,
            "step": "check-rollover-ready",
            "step_time_millis": 1659638235242,
            "is_auto_retryable_error": true,
            "failed_step_retry_count": 272,
            "phase_execution": {
                "policy": "ml-size-based-ilm-policy",
                "phase_definition": {
                    "min_age": "0ms",
                    "actions": {
                        "rollover": {
                            "min_docs": 1,
                            "max_primary_shard_docs": 200000000,
                            "max_size": "50gb"
                        }
                    }
                },
                "version": 1,
                "modified_date_in_millis": 1596956519004
            }
        }
    }
}

Finally, domains-ukraine-war-2022.04.23

{
    "indices": {
        "domains-ukraine-war-2022.04.23": {
            "index": "domains-ukraine-war-2022.04.23",
            "managed": true,
            "policy": "30-days-default",
            "index_creation_date_millis": 1650726014406,
            "time_since_index_creation": "773.66d",
            "lifecycle_date_millis": 1650726014406,
            "age": "773.66d",
            "phase": "hot",
            "phase_time_millis": 1717570285992,
            "action": "rollover",
            "action_time_millis": 1650727047545,
            "step": "ERROR",
            "step_time_millis": 1717570885866,
            "failed_step": "check-rollover-ready",
            "is_auto_retryable_error": true,
            "failed_step_retry_count": 53499,
            "step_info": {
                "type": "illegal_argument_exception",
                "reason": "index name [domains-ukraine-war-2022.04.23] does not match pattern '^.*-\\d+$'"
            },
            "phase_execution": {
                "policy": "30-days-default",
                "phase_definition": {
                    "min_age": "0ms",
                    "actions": {
                        "rollover": {
                            "max_age": "30d",
                            "min_docs": 1,
                            "max_primary_shard_docs": 200000000,
                            "max_primary_shard_size": "50gb"
                        }
                    }
                },
                "version": 1,
                "modified_date_in_millis": 1638934521506
            }
        }
    }
}

PS: If the index's name causes questions, I am a student at the University of Oxford researching DNS, wherein I was trying to ascertain if, before the Russian invasion of Ukraine, were there domains set up for electronic warfare or other malicious purposes.

Thank you.

Thanks for following up, @parthmaniar. I was referencing ILM rollover. If your index uses rollover, make sure the following settings are configured: index.lifecycle.rollover_alias.

For .ml-state-000001, this index seems stuck in the check-rollover-ready step of the rollover action, the current index size and the document count to see if it meets the rollover conditions. You will want no issues with the cluster state or shard allocation that could affect the rollover. If conditions are met and the rollover still fails, consider manually rolling over the index using the Rollover API:

POST /<alias>/_rollover

For domains-ukraine-war-2022.04.23, have you tried reindexing here?

In a general sense, you may want to ensure that the ILM policies are correctly configured and match the expected index naming patterns and rollover conditions. You also could use the _cluster/health API to monitor the cluster's overall health and address any underlying issues affecting ILM. In addition, audit logging should be enabled to track changes to ILM policies and identify any recent modifications that could be causing problems. You can also use the _ilm/explain API regularly to monitor the status of your indices and promptly address any stagnating actions.