In_flight_request is too large and throw [circuit_breaking_exception] [parent] Data too large

{"statusCode":500,"error":"Internal Server Error","message":"[parent] Data too large, data for [indices:data/read/get[s]] would be [32115499902/29.9gb], which is larger than the limit of [31621696716/29.4gb], real usage: [32115499744/29.9gb], new bytes reserved: [158/158b], usages [request=16784/16.3kb, fielddata=10094/9.8kb, in_flight_requests=26202187842/24.4gb, accounting=2264280/2.1mb]: [circuit_breaking_exception] [parent] Data too large, data for [indices:data/read/get[s]] would be [32115499902/29.9gb], which is larger than the limit of [31621696716/29.4gb], real usage: [32115499744/29.9gb], new bytes reserved: [158/158b], usages [request=16784/16.3kb, fielddata=10094/9.8kb, in_flight_requests=26202187842/24.4gb, accounting=2264280/2.1mb], with { bytes_wanted=32115499902 & bytes_limit=31621696716 & durability=\"TRANSIENT\" }"}
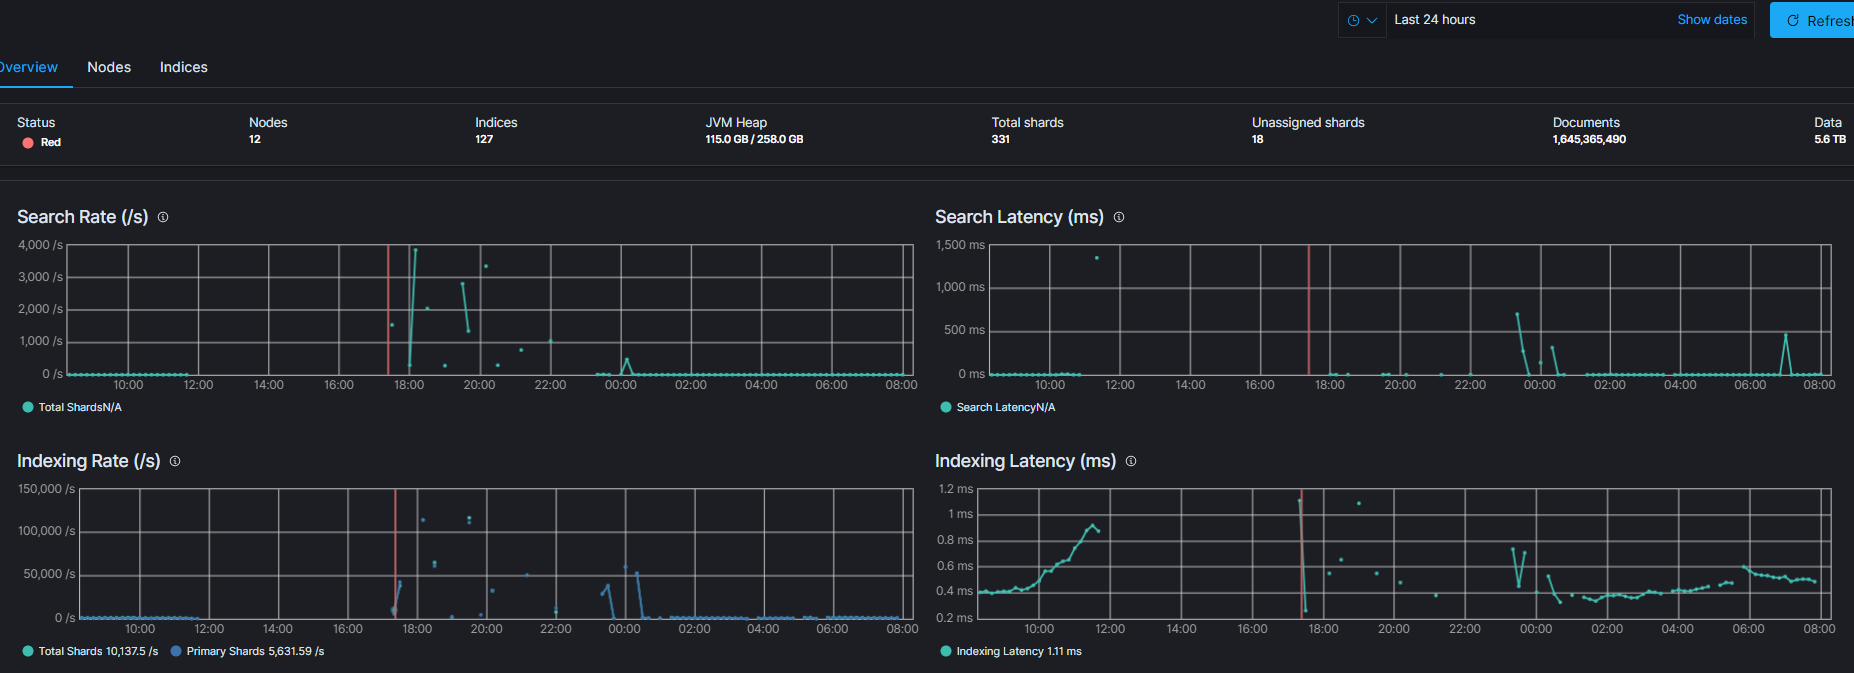
Hello guy, I am stuck in this error for weeks. After 85% migrating user to new microservices app. We are starting to have huge in_flight_request and throw circuit_breaking_exception error. I am using Elastic Cloud Kubernetes (ECK) 7.8.1. I had customized the threadpool values and node indices level tuning but it didnt help (I have commented all customized values in configmap) so I reverted all to default configuration except for JVM Heap. I set JVM heap 50% of container memory(Hot: 31gb, Warm: 31gb, Cold: 16gb). But still not resolved the issues. We have implemented Hot War Cold architecture for index lifecycle, but it ddidnt help to resolved the issues. Our log size per day with replica is 350gb for the application alone (not included APM, metricbeat, filebeat,etc). Our log data retention is 30day for Delete phase. I am wondering why my in_flight_request is so huge 24.4gb which then throws [circuitbreakingexception] error? Do I have to upgrade data nodes horizontally by adding new nodes solved this issues? because JVM max memory can't go beyond 32gb as suggested by elastic docs. Please helped me to solved this issue. By the way, Golang microservices logs send logs directly to elasticsearch using golang esapi without leveraging logstash because our microservices is in different kubernetes cluster with Elasticsearch. Here is ECK yaml.

kind: Elasticsearch
metadata:
  name: eck
  namespace: eck
spec:
  nodeSets:
    - config:
        node.data: false
        node.ingest: false
        node.master: true
        node.ml: false
        xpack.monitoring.collection.enabled: true
        #node.processors: 2
      count: 3
      name: master
      podTemplate:
        metadata: {}
        spec:
          containers:
            - name: elasticsearch
              resources:
                limits:
                  memory: 16000Mi
                  cpu: 2000m
                requests:
                  memory: 15000Mi
                  cpu: 1500m
              env:
                - name: ES_JAVA_OPTS
                  value: "-Xms8g -Xmx8g"
          initContainers:
            - name: sysctl
              command:
                - sh
                - "-c"
                - |
                  sysctl -w vm.max_map_count=262144
                  bin/elasticsearch-plugin remove repository-s3
                  bin/elasticsearch-plugin install --batch repository-s3
                  echo $AWS_ACCESS_KEY_ID | bin/elasticsearch-keystore add --stdin --force s3.client.default.access_key
                  echo $AWS_SECRET_ACCESS_KEY | bin/elasticsearch-keystore add --stdin --force s3.client.default.secret_key
              env:
                - name: AWS_ACCESS_KEY_ID
                  valueFrom:
                    secretKeyRef:
                      key: access-key
                      name: axisnet-s3-keys
                - name: AWS_SECRET_ACCESS_KEY
                  valueFrom:
                    secretKeyRef:
                      key: secret-key
                      name: axisnet-s3-keys
              securityContext:
                privileged: true
          nodeSelector:
            target: master-node
      volumeClaimTemplates:
        - metadata:
            name: elasticsearch-data
          spec:
            accessModes:
              - ReadWriteOnce
            resources:
              requests:
                storage: 10Gi
            storageClassName: gp2
    - config:
        node.data: true
        node.ingest: false
        node.master: false
        node.ml: true
        xpack.monitoring.collection.enabled: true
        node.attr.data: hot
        thread_pool.snapshot.max: 4
        # thread_pool.write.size: 9
        # thread_pool.write.queue_size: 2000
        # thread_pool.search.size: 13
        # thread_pool.search.queue_size: 4000
        # indices.memory.index_buffer_size: 30%
        # indices.queries.cache.size: 20%
        # indices.requests.cache.size: 4%
        # indices.breaker.total.use_real_memory: true
        # indices.breaker.total.limit: 95%
        # indices.fielddata.cache.size: 30%
        # indices.requests.cache.expire: 1h
        # network.breaker.inflight_requests.limit: 50%
        # node.processors: 8
      count: 3
      name: data-hot
      podTemplate:
        spec:
          containers:
            - name: elasticsearch
              resources:
                limits:
                  memory: 64000Mi
                  cpu: 8000m
                requests:
                  memory: 62000Mi
                  cpu: 7000m
              env:
                - name: ES_JAVA_OPTS
                  value: "-Xms31g -Xmx31g"
          initContainers:
            - name: sysctl
              command:
                - sh
                - "-c"
                - |
                  sysctl -w vm.max_map_count=262144
                  swapoff -a
                  bin/elasticsearch-plugin remove repository-s3
                  bin/elasticsearch-plugin install --batch repository-s3
                  echo $AWS_ACCESS_KEY_ID | bin/elasticsearch-keystore add --stdin --force s3.client.default.access_key
                  echo $AWS_SECRET_ACCESS_KEY | bin/elasticsearch-keystore add --stdin --force s3.client.default.secret_key
              env:
                - name: AWS_ACCESS_KEY_ID
                  valueFrom:
                    secretKeyRef:
                      key: access-key
                      name: axisnet-s3-keys
                - name: AWS_SECRET_ACCESS_KEY
                  valueFrom:
                    secretKeyRef:
                      key: secret-key
                      name: axisnet-s3-keys
              securityContext:
                privileged: true
          nodeSelector:
            target: data-hot
      volumeClaimTemplates:
        - metadata:
            name: elasticsearch-data
          spec:
            accessModes:
              - ReadWriteOnce
            resources:
              requests:
                storage: 500Gi
            storageClassName: gp2
    - config:
        node.data: true
        node.ingest: true
        node.master: false
        node.ml: true
        xpack.monitoring.collection.enabled: true
        node.attr.data: warm
        thread_pool.snapshot.max: 4
        # thread_pool.write.size: 9
        # thread_pool.write.queue_size: 2000
        # thread_pool.search.size: 13
        # thread_pool.search.queue_size: 4000
        # indices.queries.cache.size: 20%
        # indices.requests.cache.size: 4%
        # indices.memory.index_buffer_size: 30%
        # indices.breaker.total.use_real_memory: true
        # indices.breaker.total.limit: 95%
        # indices.fielddata.cache.size: 30%
        # indices.requests.cache.expire: 1h
        # network.breaker.inflight_requests.limit: 50%
        # node.processors: 8
      count: 3
      name: data-warm
      podTemplate:
        metadata: {}
        spec:
          containers:
            - name: elasticsearch
              resources:
                limits:
                  memory: 64000Mi
                  cpu: 8000m
                requests:
                  memory: 62000Mi
                  cpu: 7000m
              env:
                - name: ES_JAVA_OPTS
                  value: "-Xms31g -Xmx31g"
          initContainers:
            - name: sysctl
              command:
                - sh
                - "-c"
                - |
                  sysctl -w vm.max_map_count=262144
                  swapoff -a
                  bin/elasticsearch-plugin remove repository-s3
                  bin/elasticsearch-plugin install --batch repository-s3
                  echo $AWS_ACCESS_KEY_ID | bin/elasticsearch-keystore add --stdin --force s3.client.default.access_key
                  echo $AWS_SECRET_ACCESS_KEY | bin/elasticsearch-keystore add --stdin --force s3.client.default.secret_key
              env:
                - name: AWS_ACCESS_KEY_ID
                  valueFrom:
                    secretKeyRef:
                      key: access-key
                      name: axisnet-s3-keys
                - name: AWS_SECRET_ACCESS_KEY
                  valueFrom:
                    secretKeyRef:
                      key: secret-key
                      name: axisnet-s3-keys
              securityContext:
                privileged: true
          nodeSelector:
            target: data-warm
      volumeClaimTemplates:
        - metadata:
            name: elasticsearch-data
          spec:
            accessModes:
              - ReadWriteOnce
            resources:
              requests:
                storage: 1500Gi
            storageClassName: gp2
    - config:
        node.data: true
        node.ingest: true
        node.master: false
        node.ml: false
        xpack.monitoring.collection.enabled: true
        node.attr.data: cold
        # thread_pool.snapshot.max: 2
        # thread_pool.write.size: 5
        # thread_pool.write.queue_size: 2000
        # thread_pool.search.size: 7
        # thread_pool.search.queue_size: 4000
        # indices.queries.cache.size: 20%
        # indices.requests.cache.size: 4%
        # indices.memory.index_buffer_size: 20%
        # indices.breaker.total.use_real_memory: true
        # indices.breaker.total.limit: 95%
        # indices.fielddata.cache.size: 20%
        # indices.requests.cache.expire: 1h
        # network.breaker.inflight_requests.limit: 50%
        # node.processors: 4
      count: 3
      name: data-cold
      podTemplate:
        metadata: {}
        spec:
          containers:
            - name: elasticsearch
              resources:
                limits:
                  memory: 32000Mi
                  cpu: 4000m
                requests:
                  memory: 30000Mi
                  cpu: 3000m
              env:
                - name: ES_JAVA_OPTS
                  value: "-Xms16g -Xmx16g"
          initContainers:
            - name: sysctl
              command:
                - sh
                - "-c"
                - |
                  sysctl -w vm.max_map_count=262144
                  swapoff -a
                  bin/elasticsearch-plugin remove repository-s3
                  bin/elasticsearch-plugin install --batch repository-s3
                  echo $AWS_ACCESS_KEY_ID | bin/elasticsearch-keystore add --stdin --force s3.client.default.access_key
                  echo $AWS_SECRET_ACCESS_KEY | bin/elasticsearch-keystore add --stdin --force s3.client.default.secret_key
              env:
                - name: AWS_ACCESS_KEY_ID
                  valueFrom:
                    secretKeyRef:
                      key: access-key
                      name: axisnet-s3-keys
                - name: AWS_SECRET_ACCESS_KEY
                  valueFrom:
                    secretKeyRef:
                      key: secret-key
                      name: axisnet-s3-keys
              securityContext:
                privileged: true
          nodeSelector:
            target: data-cold
      volumeClaimTemplates:
        - metadata:
            name: elasticsearch-data
          spec:
            accessModes:
              - ReadWriteOnce
            resources:
              requests:
                storage: 5000Gi
            storageClassName: st1
  version: 7.8.1```

When do you get this response, is it during a specific dashboard from Kibana?

hi warkolm thank you for your reply. No it is not during spesific dashboard. we always has this reponse every peak hours in production everytime we open kibana or elasticsearch due to heavy indexing but after peak hours elasticsearch become stable and didnt throw that error response. We also frequently get error in golang container microservices "failed to send data to elasticsearch" and "could not get index elastic unexpected EOF" due to heavy indexing in peak hours. For your information, we utilized go-esapi to send data to elastic.

Do you have Monitoring enabled?

yes, I have xpack monitoring enabled, you can see in the our ECK Yaml. is it causing the issue?

It should give you insight into what's happening at the time you see these issues.
Is heap use high, what about GC? How high is your indexing? Your querying?

that is the problem,we cant see heap in monitoring, we can't barely open Kibana when the issues is happening. our JVM heap might takes approximately half of the total heap allocated 156gb at most. Our indexing rate and latency is high during the peaks. We didnt have much complex query in our dashboard .

You can still open Monitoring post-issue, so you can do a retrospective.

yeah that might help, but can you tell me why our network.breaker. in_flight_request consume so much memory heap memory? I have seen another thread about circuit_breaking_exception, but their inflight_request didnt consume huge memory as mine.

The error is telling you that this is a get request that would cause an OOM if it were allowed to run.

But unless you can see what else is taking your heap, and pushing heap use to such high levels, focussing on this specific error is a bit pointless.

this is the monitoring for 24 hours and it can show you the indexing, search rate, heap usages metrics and troughput during the peak. Xpack monitoring didn't provide timeseries for heap usages. Do you have any suggestion, specified instruction, or approach I have to take to solved this issues?

You might need to look at hot threads on some of your nodes when they are under load to see what's happening.
Also checking your logs for GC timings would be useful.

Okay thank you Mark. oh yeah I forgot to tell you., if I stop all microservices app from sending enourmous logs to elastic, the error response will be gone. I am suspecting the indexing from the apps so huges. Our APM frequently has an queue is fulll error. So if I implement logstash to filter the logs from the app that we didn't need to improve the index ( I also had tuned some indexfor instance, refresh interval 30s) . Can it significantly resolved the issuess?

okay I will look into it, previous logs from the kubernetes pods of data nodes (hot & warm) give me the same error logs with the response about transport exception and circuit_breaking_exception.

Sounds like indexing is a major contributor then. Are you using hot/warm tiering for your cluster, or just indexing to any node in the cluster?

Not indexing data you don't need will help the load, yes. I don't know if that will be significant as I don't know your data volumes.

our data volumes is huges as you can see the monitoring screenshot I shared. We implemented hot warm. Heres is the details, our data nodes consist of 9 data nodes. 3 Hot nodes with 8cpu, 64gb(31gb jvm heap) ram each nodes, 3 Warm nodes with 8cpu, 64gb (31gb jvm heap) ram each nodes, 3 cold nodes with 4 cpu, 32gb (15gb jvm heap).
Should filtering logs dont help, do I have to upgrade horizontally from 3 to 6 nodes? I have done some indexing tuning but it didnt help much as recommended in elatic doc.

You might need to add more nodes, there's only so much you can do with given resources.

What sort of disk are you using?

We are using AWS EBS General Purpose SSD for data hot and warm, and Optimzed througput HDD for data cold. we were using IOPS SSD for data hot before. there might be bottleneck issues using virtual network stroges (AWS EBS)?
Furthermore, regarding adding more nodes, our current resource usage is never go beyond 65% during the peak for both memory and CPU from what we saw in our prometheus monitoring.

How much data does each of the hot nodes hold? What is the the size of the EBS disks attached to them?

What does iostat -x -d 2 5 give on these nodes during peak indexing when the issues occur?

The heap should not be larger than around 30GB. If you set it to exactly 32GB you will no longer benefit from compressed pointers, which will result in higher heap usage.

1 Like

well noted Christian, My JVM is not precisely 32gb, I set it 31gb, I will test in 30gb for jvm heap.
Each Hot nodes is attached with 500gb GP SSD(gp). Warm nodes is attached with 1500gb Gp SSD(gp), and Cold nodes is attached with 5000gb of HDD Optimized (st1).