-
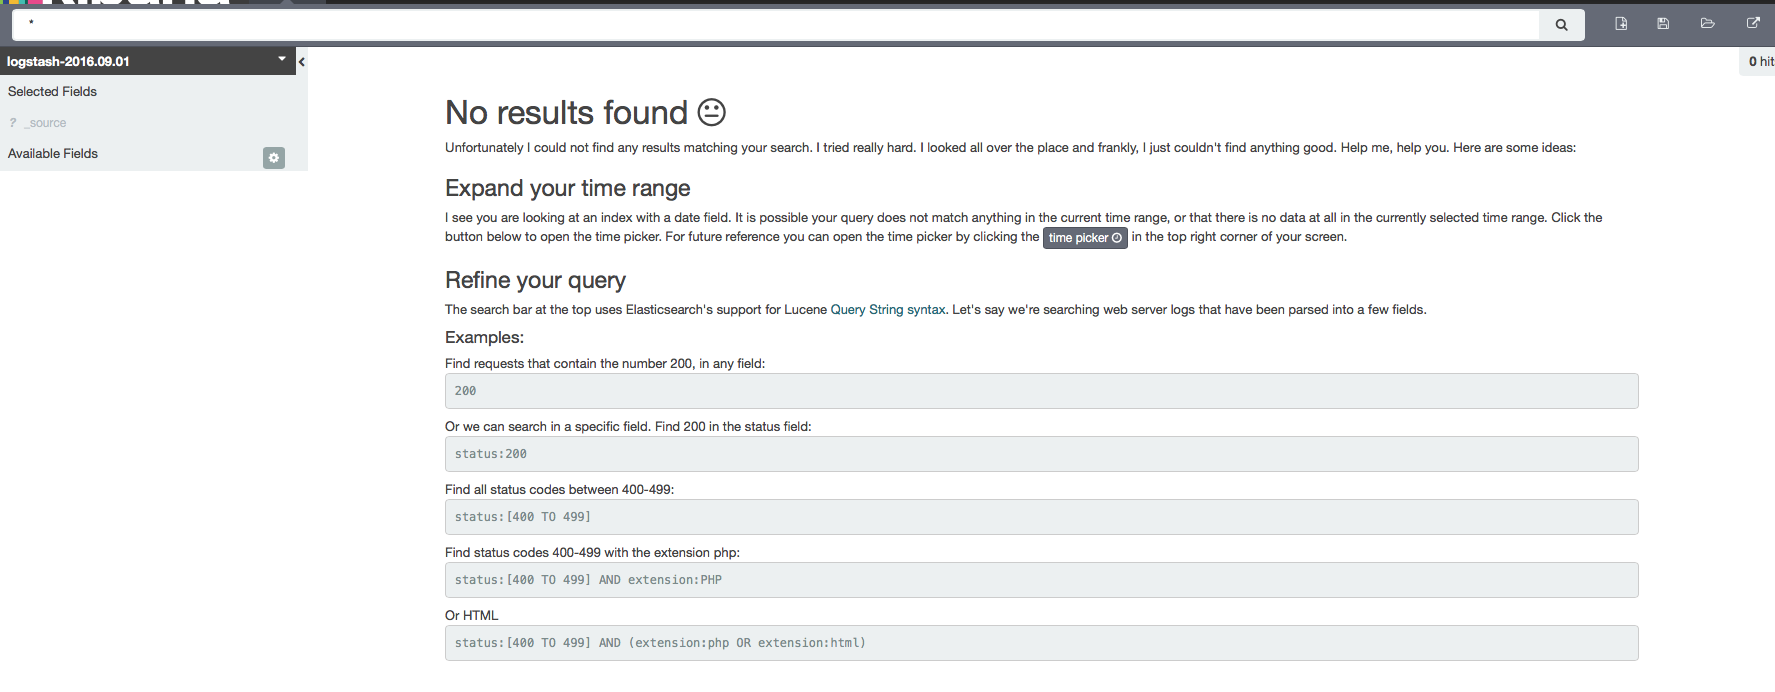
I am viewing the data of index-2016.09.01 from kibana, which i parsed yesterday evening. I can find this index in Setting. However, when i go to Discover, it is not available. Setting the time to "yesterday" or "the day before yesterday" don't work as well.
Would you have any idea why? This situation happens before as well. -
also i encountered the problem of "Field data loading is forbidden on [date]" when i try to view dates fields (their data type is date). Any idea why this happens?
Hi Allie,
I am viewing the data of index-2016.09.01 from kibana, which i parsed yesterday evening. I can find this index in Setting. However, when i go to Discover, it is not available.
What happens if you make the following API call against Elasticsearch directly?
GET index-2016.09.01/_search
Do you get any results back?
also i encountered the problem of "Field data loading is forbidden on [date]"
What does the Elasticsearch mapping for this field look like? You can retrieve the mapping by calling the GET <index name> Elasticsearch API.
-
1, i write this command: curl -XGET 'http://localhost:9200/index-2016.09.01/_search'. This is the response:
{"error":{"root_cause":[{"type":"index_not_found_exception","reason":"no such index","resource.type":"index_or_alias","resource.id":"index-2016.09.01","index":"index-2016.09.01"}],"type":"index_not_found_exception","reason":"no such index","resource.type":"index_or_alias","resource.id":"index-2016.09.01","index":"index-2016.09.01"},"status":404}
(but i can see this index in ES head and Kibana Setting. The command works for other previous index as well) -
2, my command: curl -XGET 'http://localhost:9200/date'
response is similar below:
{"error":{"root_cause":[{"type":"index_not_found_exception","reason":"no such index","resource.type":"index_or_alias","resource.id":"date","index":"date"}],"type":"index_not_found_exception","reason":"no such index","resource.type":"index_or_alias","resource.id":"date","index":"date"},"status":404}
For 1:
It appears there is no index named index-2016.09.01 in Elasticsearch. Can you go to the index patterns view in Kibana Settings and hit the refresh button for this index? What does that do?
Also, can you run curl -X GET 'http://localhost:9200/_cat/indices? That will tell us what indices you actually have in Elasticsearch.
For 2:
In your curl request, "date" needs to be replaced with the name of the index in which "date" is a field. When you encountered the "Field data loading..." error, which index were you working with?
- 1, yes i do have 2016.09.01 index as below shows. However, Kibana Discover says "No Result Found". I now can find it in yesterday though. In Setting views, everything shows normal. I am very afraid tomorrow or next week it disappeared again.
yangyan-osx:2.3.5 yangyan$ curl -XGET 'http://localhost:9200/_cat/indices'
yellow open data 5 1 1 0 3.7kb 3.7kb
yellow open logstash-2016.08.31 5 1 1 0 7.8kb 7.8kb
yellow open logstash-2016.08.30 5 1 9584 0 1.2mb 1.2mb
yellow open logstash-2016.09.01 5 1 3004283 0 276mb 276mb
yellow open .marvel-es-1-2016.08.26 1 1 46371 464 14.6mb 14.6mb
yellow open .marvel-es-data-1 1 1 14 6 28.1kb 28.1kb
yellow open .kibana 1 1 29 2 80.2kb 80.2kb
yellow open my_index 5 1 0 0 795b 795b
yellow open .marvel-es-1-2016.08.19 1 1 361 0 122kb 122kb
yellow open .marvel-es-1-2016.08.30 1 1 58219 406 19.8mb 19.8mb
yellow open .marvel-es-1-2016.08.31 1 1 42430 432 13.6mb 13.6mb
yellow open logstash-2016.08.26 5 1 9587 0 3.5mb 3.5mb
yellow open logstash-2016.08.25 5 1 3 0 24.1kb 24.1kb
yellow open .marvel-es-1-2016.09.01 1 1 24945 504 19.9mb 19.9mb
- 2, sorry corrected the command and below shows the mapping (looks ok for me):
{"logstash-2016.09.01":{"aliases":{},"mappings":{"logs":{"_all":{"enabled":true,"omit_norms":true},"dynamic_templates":[{"message_field":{"mapping":{"fielddata":{"format":"disabled"},"index":"analyzed","omit_norms":true,"type":"string"},"match":"message","match_mapping_type":"string"}},{"string_fields":{"mapping":{"fielddata":{"format":"disabled"},"index":"analyzed","omit_norms":true,"type":"string","fields":{"raw":{"ignore_above":256,"index":"not_analyzed","type":"string"}}},"match":"","match_mapping_type":"string"}}],"properties":{"@timestamp":{"type":"date","format":"strict_date_optional_time||epoch_millis"},"@version":{"type":"string","index":"not_analyzed"},"app_id":{"type":"string","norms":{"enabled":false},"fielddata":{"format":"disabled"},"fields":{"raw":{"type":"string","index":"not_analyzed","ignore_above":256}}},"date":{"type":"date","format":"strict_date_optional_time||epoch_millis"},"geoip":{"dynamic":"true","properties":{"ip":{"type":"ip"},"latitude":{"type":"float"},"location":{"type":"geo_point"},"longitude":{"type":"float"}}},"locale":{"type":"string","norms":{"enabled":false},"fielddata":{"format":"disabled"},"fields":{"raw":{"type":"string","index":"not_analyzed","ignore_above":256}}},"member_id":{"type":"long"},"p_contentId":{"type":"long"},"p_source":{"type":"string","norms":{"enabled":false},"fielddata":{"format":"disabled"},"fields":{"raw":{"type":"string","index":"not_analyzed","ignore_above":256}}},"p_typeId":{"type":"long"}}},"default":{"_all":{"enabled":true,"omit_norms":true},"dynamic_templates":[{"message_field":{"mapping":{"fielddata":{"format":"disabled"},"index":"analyzed","omit_norms":true,"type":"string"},"match":"message","match_mapping_type":"string"}},{"string_fields":{"mapping":{"fielddata":{"format":"disabled"},"index":"analyzed","omit_norms":true,"type":"string","fields":{"raw":{"ignore_above":256,"index":"not_analyzed","type":"string"}}},"match":"","match_mapping_type":"string"}}],"properties":{"@timestamp":{"type":"date","format":"strict_date_optional_time||epoch_millis"},"@version":{"type":"string","index":"not_analyzed"},"geoip":{"dynamic":"true","properties":{"ip":{"type":"ip"},"latitude":{"type":"float"},"location":{"type":"geo_point"},"longitude":{"type":"float"}}}}}},"settings":{"index":{"creation_date":"1472689510073","refresh_interval":"5s","number_of_shards":"5","number_of_replicas":"1","uuid":"eI7vz0K4TPObVuEIQWVVig","version":{"created":"2030599"}}},"warmers":{}}}
Oh, you are referring to logstash-2016.09.01. In your original post you said index-2016.09.01 so that confused me.
Based on the output of GET /_cat/indices it appears that there is data in the logstash-2016.09.01 index. Would you mind pasting a screenshot of your Settings > Indices page from Kibana?
As for the "field data loading..." error, do you get the error if you use the @timestamp field instead of the date field?
- 1, sorry for the mis-referral. Below is the screen shot of the setting page. i think it looks ok. However, the Discover page shows it is not available, unless i hit yesterday button.

- 2, we can ignore this for now. I think it is some initial setting problem when i first initialize the index in kibana.
Thanks!
What time zone are you in? I ask because I believe the reason you need to go to yesterday for seeing data in the logstash-2016-09-01 index is that the timestamps are indexed in UTC time. So if you are west of UTC, some part of yesterday would've been 2016-09-01 in UTC time.
Looking at your index patterns page screenshot, I think what you really want here is to not have individual time-based-indices as separate index patterns. Instead I think you just want one index pattern that's logstash-* which will cover all time-based indices, past, present, and future. Then you can simply use the time picker in Kibana to narrow down the the desired time window instead.
You are right, I am America/Los_angelos timezone, so i would go to yesterday for 09.01.
Sometimes the time picker doesn't work as well. like this morning, (i am in afternoon now 4:09pm,), the yesterday, this week, both don't work...So my saved search would show no data available.
- Any connection issue for kibana possibly?
- And it seems like the issue of 2016.09.01 missing problem still doesn't get answered....
While you are on the Discover page, can you open your browser's Developer Tools console, Network tab.? Then set the timepicker to yesterday or this week.
You should see a request being made to a _field_stats endpoint and another request right after that to a _msearch endpoint. Could you open up the details of both requests and paste their responses here?
That'll help me figure out which indices are being queried and what time ranges are being used in the query.

Can you click on each of the 4 requests, one by one? This should display the details for each request. Can you share those details here please? Specifically I am looking for the body of each request and the body of each corresponding response. Thanks!
Hi Sure, the details are lengthy. And now the index is not available again unless i hit this week.
Request:
{"index":["logstash-2016.09.01"],"ignore_unavailable":true}
{"size":500,"sort":[{"@timestamp":{"order":"desc","unmapped_type":"boolean"}}],"query":{"filtered":{"query":{"query_string":{"analyze_wildcard":true,"query":""}},"filter":{"bool":{"must":[{"range":{"@timestamp":{"gte":1472342400000,"lte":1472947199999,"format":"epoch_millis"}}}],"must_not":[]}}}},"highlight":{"pre_tags":["@kibana-highlighted-field@"],"post_tags":["@/kibana-highlighted-field@"],"fields":{"":{}},"require_field_match":false,"fragment_size":2147483647},"aggs":{"2":{"date_histogram":{"field":"@timestamp","interval":"3h","time_zone":"UTC","min_doc_count":0,"extended_bounds":{"min":1472342400000,"max":1472947199999}}}},"fields":["*","_source"],"script_fields":{},"fielddata_fields":["date","@timestamp"]}
Response:
{
"responses": [{
"took": 131,
"timed_out": false,
"_shards": {
"total": 5,
"successful": 5,
"failed": 0
},
"hits": {
"total": 3004283,
"max_score": null,
"hits": [{
"_index": "logstash-2016.09.01",
"_type": "logs",
"_id": "AVbjSh_ybIXpl-fj9r_d",
"_score": null,
"_source": {
"@timestamp": "2016-09-01T01:08:21.036Z",
"app_id": "as",
"date": "2016-08-30T21:59:41.000Z",
"member_id": - 1,
"locale": "en_US",
"p_source": "jem",
"p_typeId": 3,
"p_contentId": null
},
"fields": {
"date": [1472594381000],
"@timestamp": [1472692101036]
},
"sort": [1472692101036]
}, {
"_index": "logstash-2016.09.01",
"_type": "logs",
"_id": "AVbjSh_ybIXpl-fj9r_c",
"_score": null,
"_source": {
"@timestamp": "2016-09-01T01:08:21.035Z",
"app_id": "as",
"date": "2016-08-30T21:59:36.000Z",
"member_id": 29822052,
"locale": "en_US",
"p_source": "web",
"p_typeId": 2,
"p_contentId": 106924172
},
"fields": {
"date": [1472594376000],
"@timestamp": [1472692101035]
},
"sort": [1472692101035]
}, { repetitive pattern data
}{
"_index": "logstash-2016.09.01",
"_type": "logs",
"_id": "AVbjSh6hbIXpl-fj9r3W",
"_score": null,
"_source": {
"@timestamp": "2016-09-01T01:08:20.737Z",
"app_id": "as",
"date": "2016-08-30T21:10:04.000Z",
"member_id": - 1,
"locale": null,
"p_source": "renew",
"p_typeId": 3,
"p_contentId": null
},
"fields": {
"date": [1472591404000],
"@timestamp": [1472692100737]
},
"sort": [1472692100737]
}
]
},
"aggregations": {
"2": {
"buckets": [{
"key_as_string": "2016-08-28T00:00:00.000Z",
"key": 1472342400000,
"doc_count": 0
}, {
"key_as_string": "2016-08-28T03:00:00.000Z",
"key": 1472353200000,
"doc_count": 0
}, { repetitive pattern again till end
}