I am having an issue with kibana. My setup is a little like this:
Windows Logs from a WEC server
Linux logs including apache and weblogic
Winlogbeat and filebeat with filebeat-* index and winevnt-* index and being ingested on different ports
My problem is that when i upgraded to elastic 6.1.3 from 6.0.0, filebeat-* index is full of windows event logs even and to see the actual logs for filebeat-* index, i am forced to use filters and queries. Is this a bug or are my configurations all weirdly setup?
Can you please paste your config here( sans the sensitive data) . We may help you debug if its a wrong config . It sounds like winlogbeat logs are going to filebeat-?
Anyways either way it's a misconfiguration somewhere - either kibana has an index pattern that's matching all indices () or winlogbeat and filebeat are configured to point to the wrong indices.
They are different configs btw. One if for recieving windows logs and
the other one is for recieving linux and other application logs
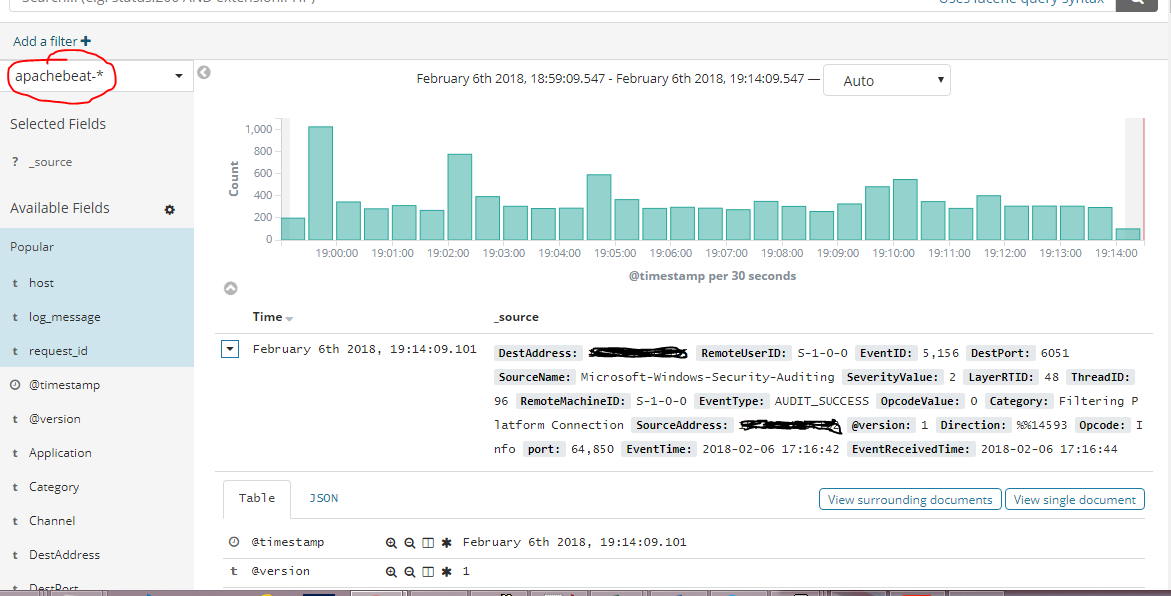
especially apache and others am having. But when i select the
apachebeat* index from the discover console, it displays windows logs
instead which is very odd
Apache, Apache Lucene, Apache Hadoop, Hadoop, HDFS and the yellow elephant
logo are trademarks of the
Apache Software Foundation
in the United States and/or other countries.