Index pattern for Grafana

Hello
I am not sure whether i can ask this here. Just trying my luck here.
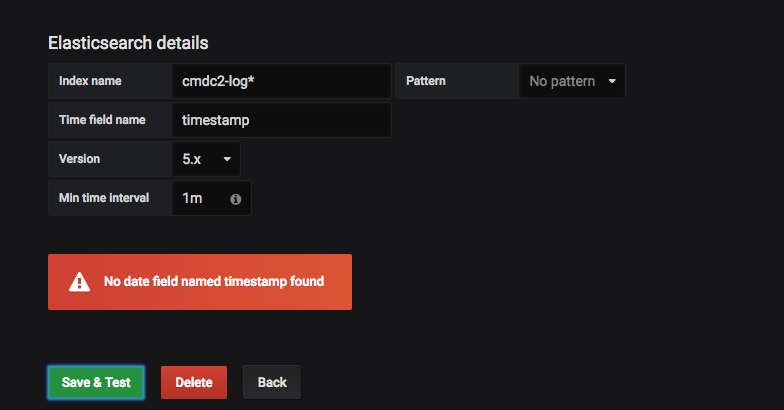
I am integrating Grafana with ElasticSearch. In the Grafana screen, i need to give the ElasticSearch details.
What is the value for Index?

This is what is in my logstash config

 if "_grokparsefailure" in [tags] {
 elasticsearch {
   hosts => "84.210.206.233:9200"
   #protocol => "http"
   #port => 9200
   #cluster => "elk_cluster"
   index => "cmdc2-error-%{cmdcLogId}"
   document_type => "error_logs"
   codec => "json"
 }
} else {
 elasticsearch {
   hosts => "84.210.206.233:9200"
   #protocol => "http"
   #port => 9200
   #cluster => "elk_cluster"
   index => "cmdc2-log-%{+YYYY.MM.dd}"
   document_type => "%{target}_logs"
   codec => "json"
 }
}
}

Should i give the value cmdc2-log-%{+YYYY.MM.dd} as index in Grafana page?

Hi @Roshan_r,

do you use Kibana at all? You can use the same index pattern in Grafana.

For you cmdc2-* should work if you want to be able to query all ES indices from the same Grafana query.

Yes. I use Kibana.

Please find attached the indices used in Kibana27

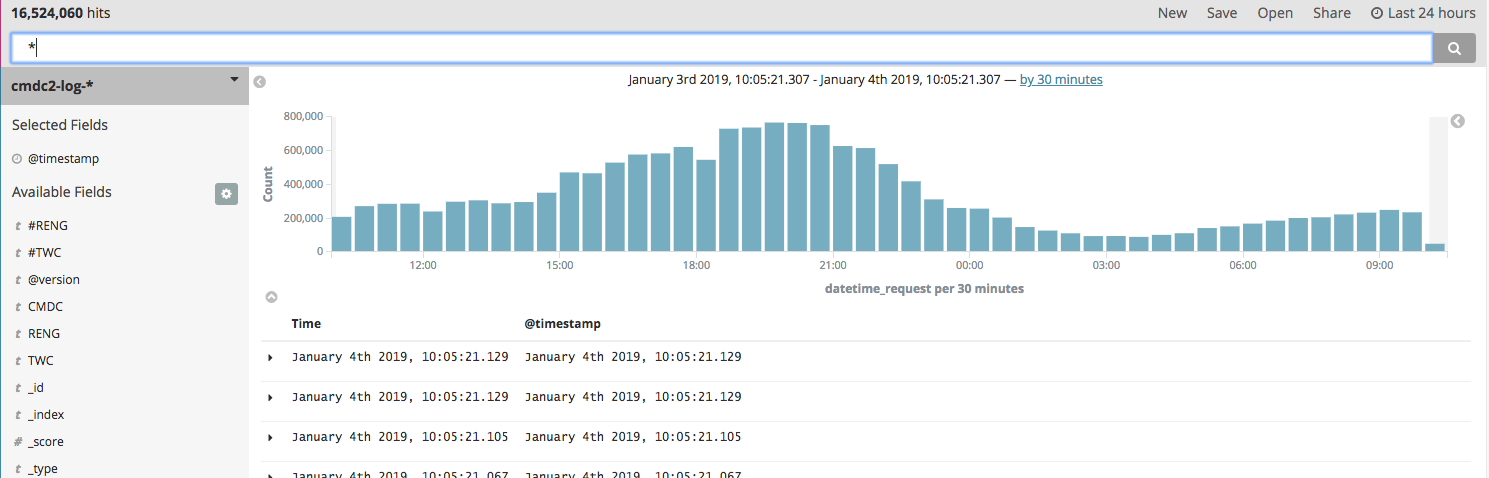
Ok. I can see the error gone after using cmdc2-* . When i enter @timestamp in Time Field name.. i got an error saying "No date field named @timestamp found) . Any idea where i can get the correct field name?07

Which field does Kibana use for cmdc2-log-*? Use the same in Grafana.

This is what I have in Grafana

image

So, maybe set Pattern to No pattern as well.

Please see the attached from Kibana. I have @timestamp .

Please find attached grafana page also.

I have fixed it. I deleted the field and manually gave @timestamp and it worked.

Many many thanks for your help

This topic was automatically closed 28 days after the last reply. New replies are no longer allowed.