Ingest pipeline creation problem

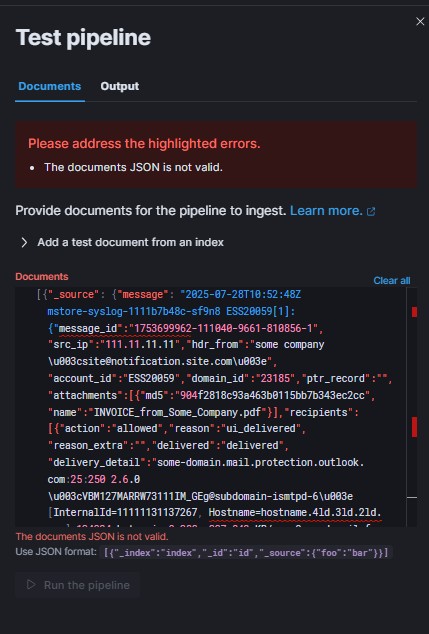
I'm trying to create an ingest pipeline using a grok porcessor to strip the syslog header and a json processor to extract the json portion of the message.

Here's the structure of the messages I need to ingest:

2025-07-28T10:52:48Z mstore-syslog-1111b7b48c-sf9n8 ESS20059[1]: {"message_id":"1753699962-111040-9661-810856-1","src_ip":"111.11.11.11","hdr_from":"some company \u003csite@notification.site.com\u003e","account_id":"ESS20059","domain_id":"23185","ptr_record":"","attachments":[{"md5":"904f2818c93a463b0115bb7b343ec2cc","name":"INVOICE_from_Some_Company.pdf"}],"recipients":[{"action":"allowed","reason":"ui_delivered","reason_extra":"","delivered":"delivered","delivery_detail":"some-domain.mail.protection.outlook.com:25:250 2.6.0 \u003cVBM127MARRW73111IM_GEg@subdomain-ismtpd-6\u003e [InternalId=11111131137267, Hostname=hostname.4ld.3ld.2ld.com] 134234 bytes in 0.388, 337.842 KB/sec Queued mail for delivery","email":"user@some_domain.com","taxonomy":"policy"}],"hdr_to":"user@some_domain.com","recipient_count":1,"dst_domain":"some_domain.com","size":122243,"subject":"Phishing Attack verbage","env_from":"bounces+1117135-bef1-user=some_domain.com@e.notification.site.com","timestamp":"2025-07-28T10:52:45+0000","geoip":"","tls":true,"hdr_auth_results":""}

I run the message format above through the grok debugger in Kibana, using the following pattern, which is the same as the one used in the grok processor.

%{NOTSPACE} %{NOTSPACE} %{NOTSPACE} %{GREEDYDATA:syslog_message_content}

It produces the following results:

{
  "syslog_message_content": "{\"message_id\":\"1753699962-111040-9661-810856-1\",\"src_ip\":\"111.11.11.11\",\"hdr_from\":\"some company \\u003csite@notification.site.com\\u003e\",\"account_id\":\"ESS20059\",\"domain_id\":\"23185\",\"ptr_record\":\"\",\"attachments\":[{\"md5\":\"904f2818c93a463b0115bb7b343ec2cc\",\"name\":\"INVOICE_from_Some_Company.pdf\"}],\"recipients\":[{\"action\":\"allowed\",\"reason\":\"ui_delivered\",\"reason_extra\":\"\",\"delivered\":\"delivered\",\"delivery_detail\":\"some-domain.mail.protection.outlook.com:25:250 2.6.0 \\u003cVBM127MARRW73111IM_GEg@subdomain-ismtpd-6\\u003e [InternalId=11111131137267, Hostname=hostname.4ld.3ld.2ld.com] 134234 bytes in 0.388, 337.842 KB/sec Queued mail for delivery\",\"email\":\"user@some_domain.com\",\"taxonomy\":\"policy\"}],\"hdr_to\":\"user@some_domain.com\",\"recipient_count\":1,\"dst_domain\":\"some_domain.com\",\"size\":122243,\"subject\":\"Phishing Attack verbage\",\"env_from\":\"bounces+1117135-bef1-user=some_domain.com@e.notification.site.com\",\"timestamp\":\"2025-07-28T10:52:45+0000\",\"geoip\":\"\",\"tls\":true,\"hdr_auth_results\":\"\"}"
}

As you can see, the grok debugger inserts backslashes before all the double quote and backslash characters. I'm wondering if this is a result of the grok debugger output having to be displayed in a webpage. Does the grok processor actually insert these backslashes before it passes its output to the next processsor?

Here's my grok processor config.

Here's my json processor config.

TIA,
Brad

Hello @bbreer

We do not see \ in the Table for the field syslog_message_content as per below screenshot -

It is only shown when you see in JSON format which it uses to escape "

If needed you can parse the JSON data using below ingest processor :


PUT _ingest/pipeline/syslog_json_pipeline
{
  "description": "Extract JSON from syslog message",
  "processors": [
    {
      "grok": {
        "field": "message",
        "patterns": [
          "%{TIMESTAMP_ISO8601:log_timestamp} %{NOTSPACE:pod_name} %{NOTSPACE:account_id}\\[%{INT}\\]: %{GREEDYDATA:json_payload}"
        ],
        "ignore_missing": true
      }
    },
    {
      "json": {
        "field": "json_payload",
        "target_field": "parsed"
      }
    },
    {
      "remove": {
        "field": "json_payload"
      }
    }
  ]
}

Thanks!!

Thanks for replying Tortoise. When I create that ingest pipeline you suggested and then test the sample logfile I'm getting a "The documents JSON is not valid." error. To test the pipeline, I go to Stack Management > Ingest Pipelines > Manage > Edit, then clicking Add documents next to Test pipleine and pasting the code below between the brackets in the Documents window:

{"_source": {"message": "2025-07-28T10:52:48Z mstore-syslog-1111b7b48c-sf9n8 ESS20059[1]: {"message_id":"1753699962-111040-9661-810856-1","src_ip":"111.11.11.11","hdr_from":"some company \u003csite@notification.site.com\u003e","account_id":"ESS20059","domain_id":"23185","ptr_record":"","attachments":[{"md5":"904f2818c93a463b0115bb7b343ec2cc","name":"INVOICE_from_Some_Company.pdf"}],"recipients":[{"action":"allowed","reason":"ui_delivered","reason_extra":"","delivered":"delivered","delivery_detail":"some-domain.mail.protection.outlook.com:25:250 2.6.0 \u003cVBM127MARRW73111IM_GEg@subdomain-ismtpd-6\u003e [InternalId=11111131137267, Hostname=hostname.4ld.3ld.2ld.com] 134234 bytes in 0.388, 337.842 KB/sec Queued mail for delivery","email":"user@some_domain.com","taxonomy":"policy"}],"hdr_to":"user@some_domain.com","recipient_count":1,"dst_domain":"some_domain.com","size":122243,"subject":"Phishing Attack verbage","env_from":"bounces+1117135-bef1-user=some_domain.com@e.notification.site.com","timestamp":"2025-07-28T10:52:45+0000","geoip":"","tls":true,"hdr_auth_results":""}"}}

This is the error I'm getting:

I can't spot the json formatting issue that it's referring to. Would it be possible to see what you're posting between the brackets in the Documents window when you test it?

Thank you,
Brad

Hello @bbreer

I do not add the data, instead I add the document with below information =>

_index => find the corresponding index name for this document
_id => find the _id for any 1 of the document from the index/dataview via discover

After updating the above 2 information => Add document => Run the Pipeline

Thanks!!

Ok, ty. I guess I was misunderstanding the purpose of the Test document feature on the Editing ingest pipeline page. I thought it was meant to be fed a raw message and show how it was processed but I guess it needs an already formatted document so I gave up using it. I decided to just send the logs to the listening elastic agent and specify the ingest pipeline in the integration. Everything seems to be being parsed, however, I'm having an issue with the nested json. The recipients field and the attachments field both have nested json:

"recipients":[{"action":"allowed","reason":"ui_delivered","reason_extra":"","delivered":"delivered","delivery_detail":"some-domain.mail.protection.outlook.com:25:250 2.6.0 \u003cVBM127MARRW73111IM_GEg@subdomain-ismtpd-6.0\u003e[InternalId=11111131137267, Hostname=hostname.4ld.3ld.2ld.com] 134234 bytes in 0.388, 337.842 KB/sec Queued mail for delivery","email":"user@some_domain.com","taxonomy":"policy"}]
"attachments":[{"md5":"904f2818c93a463b0115bb7b343ec2cc","name":"INVOICE_from_Some_Company.pdf"}]

The fields in the nested json show up in the table and contain the correct values:

However, the rename processors don't rename the nested json fields. The rename processors work fine on all the non-nested json fields.

Here's the rename processor for on the nested json fields:

Not sure if this helps but here's the order of my ingest piepline:

Thank you,
Brad

Hello @bbreer

Using below was able to rename the array field :

{
      "set": {
        "field": "email.to.address",
        "value": "{{parsed.recipients.0.email}}",
        "ignore_empty_value": true
      }
}

email.to.address => your@some_domain.com

In case if the field contains multiple values than it will only return 1 field in that case we might have to use script.

Thanks!!