Hi guys.
I am faced error message while the kibana try load data into instances dashboard. Anothers dashboard such as Transactions, Throughput, CPU usage and System memory usage, all them are loaded successfully, only the instances dashboard throw this error. I am using version 7.17.
But this error does not happen while my application is running localhost. Anyone could help me understand the reason this problem?
Expected result
Could you paste the entire error message you are getting? You should be able to see it in the Networks tab in devtools of your browser.
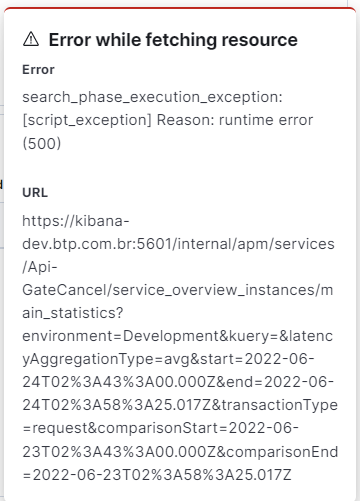
Sure, These two print screens help you?
Console Tab
Network Tab
Great. Could you also paste the request? It's the the Payload tab in the Network tab.
Yes, following request parameters
service_overview_instances/main_statistics?environment=Development&kuery=&latencyAggregationType=avg&start=2022-06-24T14%3A18%3A00.000Z&end=2022-06-24T14%3A33%3A17.979Z&transactionType=request&comparisonStart=2022-06-23T14%3A18%3A00.000Z&comparisonEnd=2022-06-23T14%3A33%3A17.979Z
There's nothing wrong with the request that I can tell. Can you try to delete your index and create it again? Helps sometimes.
I did execute delete index operation, it look likethat problem is when agent collect metrics on machine host where the application is running, because when apm index is empty the error does not happen but when there is data "Instance Dashboard" only throw error, remembering that in locahost work well.
I looked output log and seems that a error internal is happening in this request. Could you please check if i am mistaking in any step?