Is it ok to leave all my metricbeats with the default index name as long as i am able to display live data?
Or
Isit actually recommended to separate each instance's metric beat with a unique name?
I am setting up the ELK stack for the very first time and have some trouble manually loading the template with my own index name. No matter how i tried, the default index name keeps coming up.
*PS, i am new to elasticsearch and still learning from the documentation
For most of the cases the default index configuration is perfectly fine, so if you are giving your first steps with the stack the out-of-the-box configuration should be a good starting point. Once you have a better view of your needs you might consider to change the defaults.
In general this is not recommended, indexes are separated by beat, by version and by date. Separating them by beat and version allows to have different mappings, and separating by date (daily by default) helps on management, so you can for example delete old data per days.
How are you changing the index names? If you are using a 7.x version of the stack, and your Elasticsearch cluster supports Index Lifecycle Management (ILM), this feature controls your indexes, look to the ILM documentation to see how to configure it. If ILM is not being used, check template loading documentation to change the index names.
Thank you for the clarification for the default index name question!
Previously i was trying to change the index name by following the template loading documentation. I am using the 7.0.1 version and did not change much of the setting. I think ILM was controlling my indexes and i did not cover this part of the documentation yet hence rendering my manual template loading to be useless.
"Starting with version 7.0, Metricbeat uses index lifecycle management by default when it connects to a cluster that supports lifecycle management. Metricbeat loads the default policy automatically and applies it to any indices created by Metricbeat."
Thank you i did not know about this!
How are you changing the index names?
Currently i am changing my index name by editing the output filter.
# Sample Logstash configuration for creating a simple
# Beats -> Logstash -> Elasticsearch pipeline.

input {
  beats {
    port => 5044
  }
}

# The filter part of this file is commented out to indicate that it is
# optional.
filter {
    grok {
        match => { "message" => "%{COMBINEDAPACHELOG}"}
    }
    geoip {
        source => "clientip"
    }
}

output {
    stdout { codec => rubydebug }
    elasticsearch {
     hosts => ["http://esnode1:9200", "http://esnode2:9200", "http://esnode3:9200"]
     index => "itsys2-filebeat-%{+YYYY.MM.dd}"
    }
}
I am now learning/trying to receive multiple filebeats logs from windows or linux machines.
May i ask you a question on multiple pipelines?
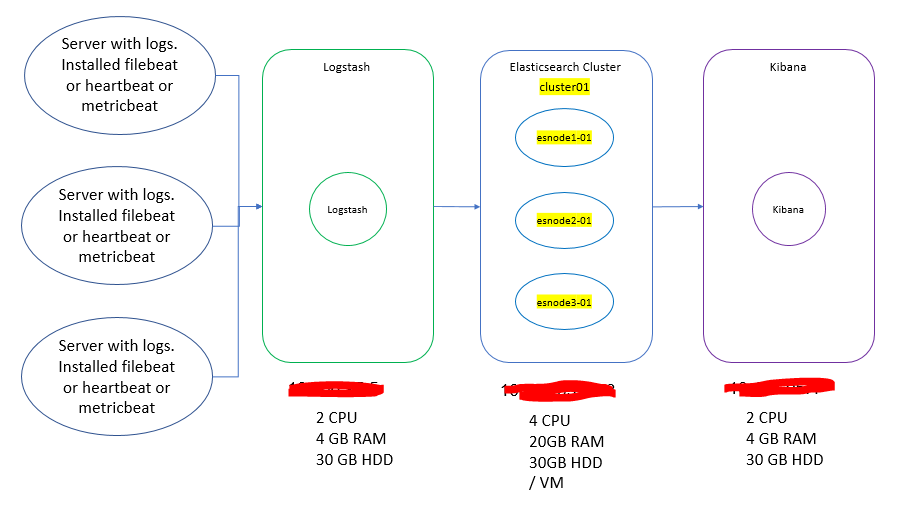
In a scenario where my logstash instance would like to collect logs from 2 client, a windows machine and linux machine where both have filebeat installed.
Is it correct/recommended to setup 2 pipelines with 2 different port numbers (5044, 5045) and i would configure the windows client to send to 5044 and linux client to send to 5045 pipe?
Or would it be better to just have 1 pipeline on logstash with port 5044 and all clients are send to that pipeline, then i should use conditional filters to seperate the logs?
i got this idea from a thread that was posted last year.
@TsuWeiQuan if you are using the Elastic Stack just for a basic logging use case, I'd recommend you to send the data directly from Beats to Elasticsearch, without Loghstash. This way it is quite easier to manage indexes and configuration, and to take advantage of filebeat modules.
So is it correct to say that if Filebeats does not contain modules for other logs format, i have to use logstash to do a custom mapping/filter?
Since logstash's purpose is to capture many other log formats like syslog, networking and firewall logs, and more.
Yes, logstash is useful in other use cases when information is being collected from other sources, or special data pipeline architectures are needed. But for most of logging use cases it should be enough with Filebeat and Elasticsearch. Take into account that filebeat also has a syslog input.
Apache, Apache Lucene, Apache Hadoop, Hadoop, HDFS and the yellow elephant
logo are trademarks of the
Apache Software Foundation
in the United States and/or other countries.