Thank you for the clarification for the default index name question!
Previously i was trying to change the index name by following the template loading documentation. I am using the 7.0.1 version and did not change much of the setting. I think ILM was controlling my indexes and i did not cover this part of the documentation yet hence rendering my manual template loading to be useless.
"Starting with version 7.0, Metricbeat uses index lifecycle management by default when it connects to a cluster that supports lifecycle management. Metricbeat loads the default policy automatically and applies it to any indices created by Metricbeat."
Thank you i did not know about this!
How are you changing the index names?
Currently i am changing my index name by editing the output filter.
# Sample Logstash configuration for creating a simple
# Beats -> Logstash -> Elasticsearch pipeline.

input {
  beats {
    port => 5044
  }
}

# The filter part of this file is commented out to indicate that it is
# optional.
filter {
    grok {
        match => { "message" => "%{COMBINEDAPACHELOG}"}
    }
    geoip {
        source => "clientip"
    }
}

output {
    stdout { codec => rubydebug }
    elasticsearch {
     hosts => ["http://esnode1:9200", "http://esnode2:9200", "http://esnode3:9200"]
     index => "itsys2-filebeat-%{+YYYY.MM.dd}"
    }
}
I am now learning/trying to receive multiple filebeats logs from windows or linux machines.
May i ask you a question on multiple pipelines?
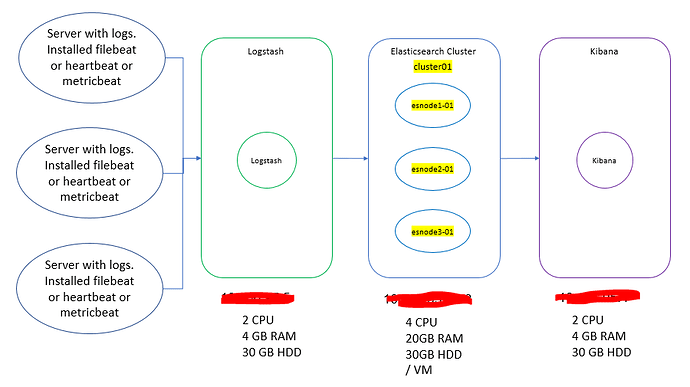
In a scenario where my logstash instance would like to collect logs from 2 client, a windows machine and linux machine where both have filebeat installed.
Is it correct/recommended to setup 2 pipelines with 2 different port numbers (5044, 5045) and i would configure the windows client to send to 5044 and linux client to send to 5045 pipe?
Or would it be better to just have 1 pipeline on logstash with port 5044 and all clients are send to that pipeline, then i should use conditional filters to seperate the logs?
i got this idea from a thread that was posted last year.
This is my current setup ![]()
Thank you @jsoriano
