It's not difficult (once you spend hours and hours figuring it out).
You have to play around with the FilterManager, for instance, on the controller.
Example:
var filterManager = Private(require('ui/filter_manager')); // Add filterManager.add('myField', '0', '', 'myindex'); // Remove filterManager.remove('myField', '0')
If you want to interact with the Filter Bar:
var queryFilter = Private(require('ui/filter_bar/query_filter')); // Then, get all filters queryFilter.getAppFilters()
Maybe I make it sound easier than it its, but I struggled with this for a couple of hours.
Good Luck
Thank you. I have been trying to find this solution as well. it helps a lot.
@JuanCarniglia, do you have any examples that run on Kibana 5.0 as well?
I'm working on that, there are some changes. I'll let you know as soon as I
get to it.
@tbragin: Is the code for spalger_guage on github? Around 31 minutes into video 'fast forwards' from empty vis_type.js into a fully coded up version. Would be great if I can see the code.
kibana Gauge plugin (with pointer)
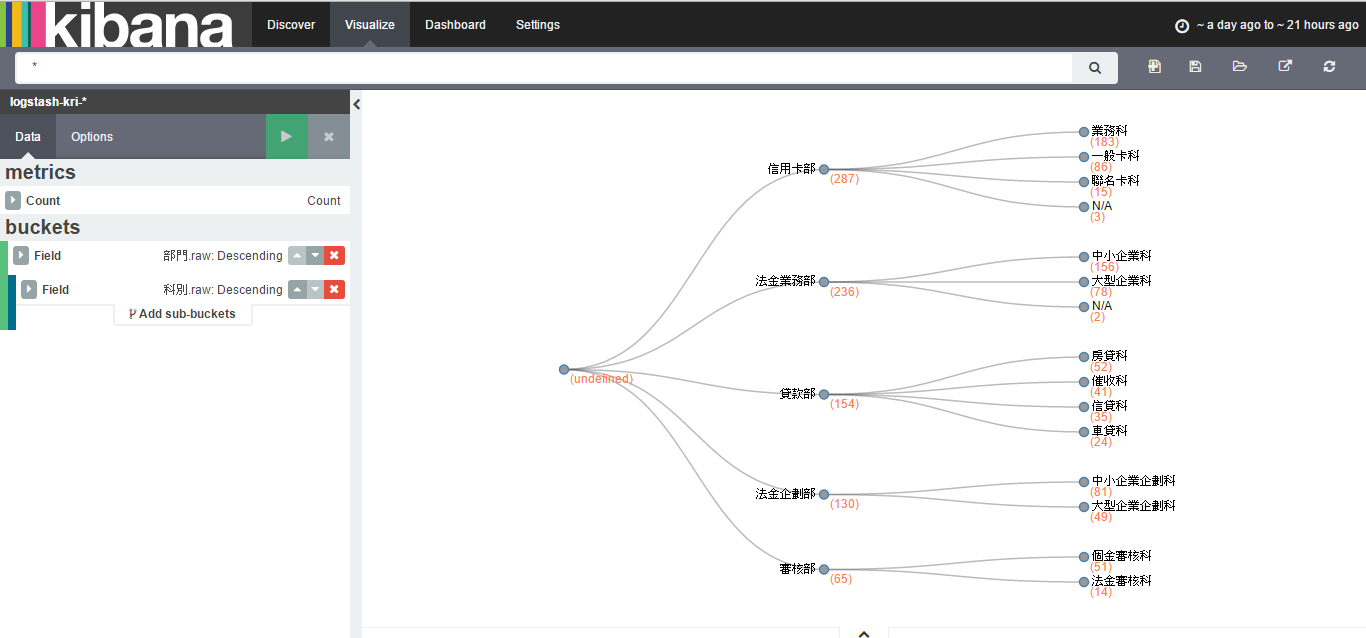
Kibana tree plugin (D3.js)
hey plz i m working with kibana 5.1.2 and i need a custom visualization that i want to create with a plugin can anyone help me with documentation or smthg i don t khow how to create it or anything
thanks