Hi Team,
I am facing issue with my Kibana line chart:
My log fields looks like in the below image:

And My line Chart looks like in the below image:
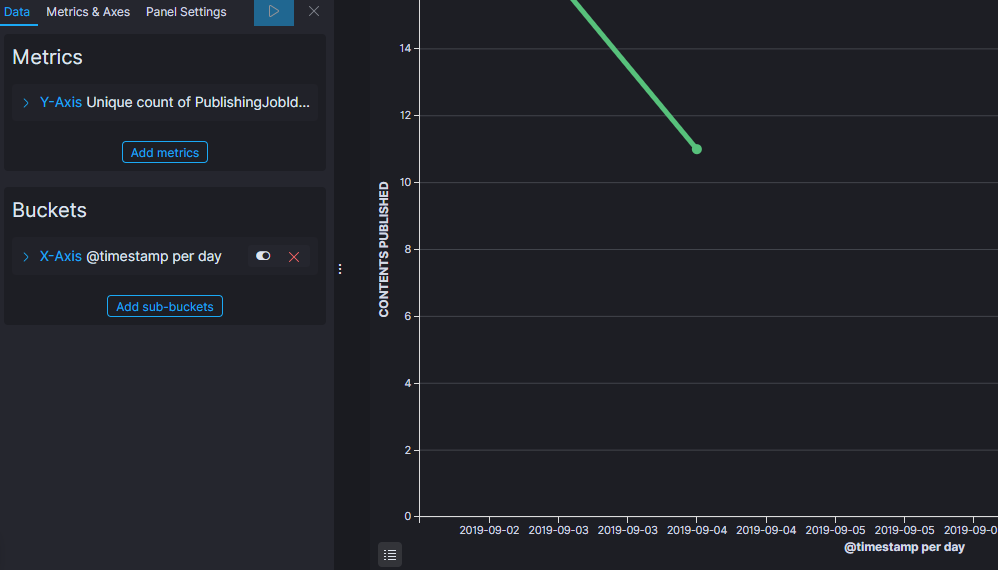
My Unique Count on y-axis using the value of fields is 31305
and x-axis is using timestamp
Now I want to filter our record without error id records. When I use to filter our record with loglevel= "error" it still showing me the count of Failure records.
Ii the image above I have a 3 unique records. In my Line graph I want to display only 3 records instead of count of 4 records.
Can you please help me to resolve this issue?