Anyone experiencing an issue where Synthetic Private Locations stop working once you upgrade to 9.1.3?
I see this:
not be initialized: browser monitors cannot be created outside the official elastic docker image├─ synthetics/browser-default-synthetics/browser-synthetics-aee3ec79-f913-4b9e-b3d0-0ec472e15b39-d1de8530-5d42-11ee-a1de-4ba9c6dbe28c│ └─ status: (FAILED) monitor could not be started: synthetics/browser-synthetics-aee3ec79-f913-4b9e-b3d0-0ec472e15b39-d1de8530-5d42-11ee-a1de-4ba9c6dbe28c-admin, err: job could not be initialized: browser monitors cannot be created outside the official elastic docker image└─ synthetics/browser-default-synthetics/browser-synthetics-b2808849-2bae-4a68-81af-c3fb74810ecd-d1de8530-5d42-11ee-a1de-4ba9c6dbe28c└─ status: (FAILED) monitor could not be started: synthetics/browser-synthetics-b2808849-2bae-4a68-81af-c3fb74810ecd-d1de8530-5d42-11ee-a1de-4ba9c6dbe28c-enterprise-systems, err: job could not be initialized: browser monitors cannot be created outside the official elastic docker image
The crazy part is I don’t have any browsers monitors running. It appears that anytime tests are run, they are still saved to the synthetic cache.
I decided to upgrade the elastic agent and even used wolfi image, but still same result.
I also have noticed that we are running about ~900 monitors but the Policy page states there are ~6,000 integrations (we have nothing running besides synthetics monitors)
Thanks for reaching out, there’re a few things we can check to better understand what’s going on.
I decided to upgrade the elastic agent and even used wolfi image, but still same result.
To me, it looks like the root cause is the agent policy configuration, so the agent version/image does not really influence that in this case.
First, I’d suggest making sure that no browser integrations are actually running. In Kibana, if you go to Fleet → Agent policies → → Actions → View policy, you’ll get a copy of the configuration that is being sent to the agent. In that file, if you search for `type: synthetics/browser`, do you get any matches?
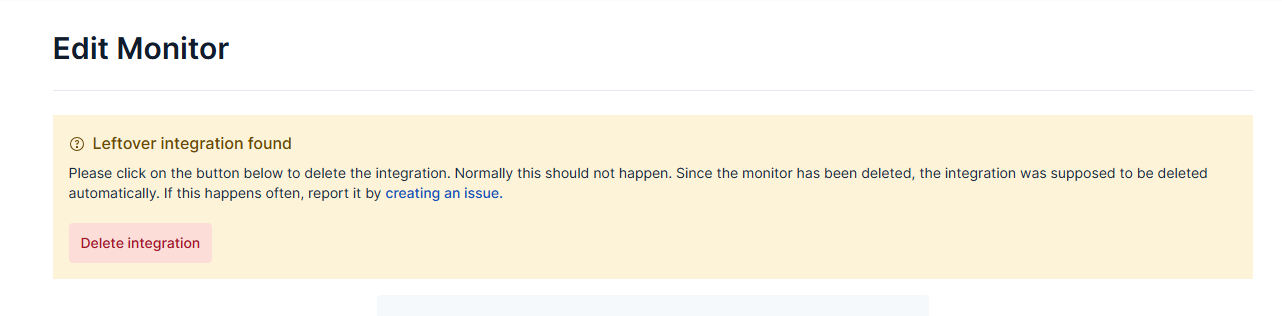
As for the leftover integrations found, we will need more information on the way synthetics is being used:
Are you using Synthetics UI to manage these monitors or are you managing them using synthetics projects?
What Kibana version is this?
What spaces is this private location shared with?
Do you recognize any patterns in the leftover monitors, as in monitors that should have been deleted or you don’t recognize any of them?
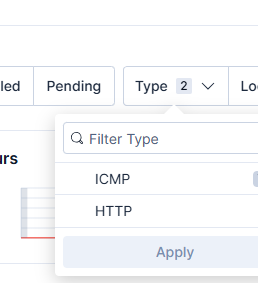
Are all of those ~6k integrations “Elastic Synthetics” integration type or are there other types?
If this is happening on an instance hosted on Elastic Cloud, I’d suggest submitting a support ticket. That will allow us to understand more quickly what’s going on.
We are on-prem and licensed, and support is struggling to figure it out.
I have now implemented a workaround. I created a new fleet policy for synthetics and added this new private location to our monitors. They are working fine now, but you are right; the issue stems from the agent policy configuration.
Hi @erikg - it sounds like you have resolved your issue. Is there any further assistance we can give in helping you achieve your goals with your self-managed Synthetics deployment?
Apache, Apache Lucene, Apache Hadoop, Hadoop, HDFS and the yellow elephant
logo are trademarks of the
Apache Software Foundation
in the United States and/or other countries.