Kibana 7.13.0 APM Dashboard not showing some environments

Hi,

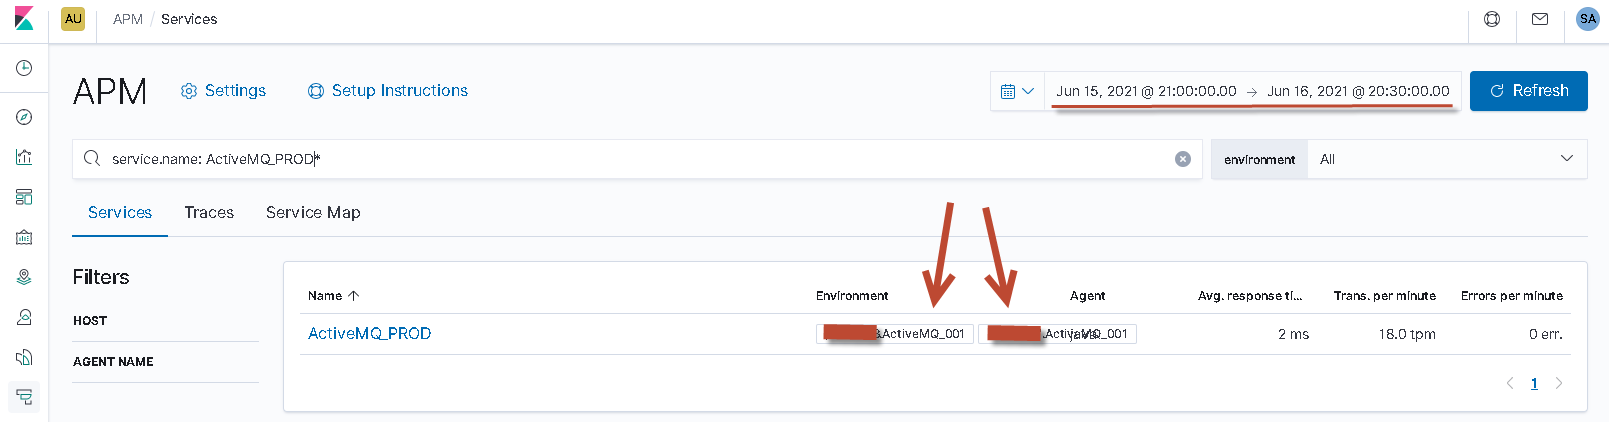
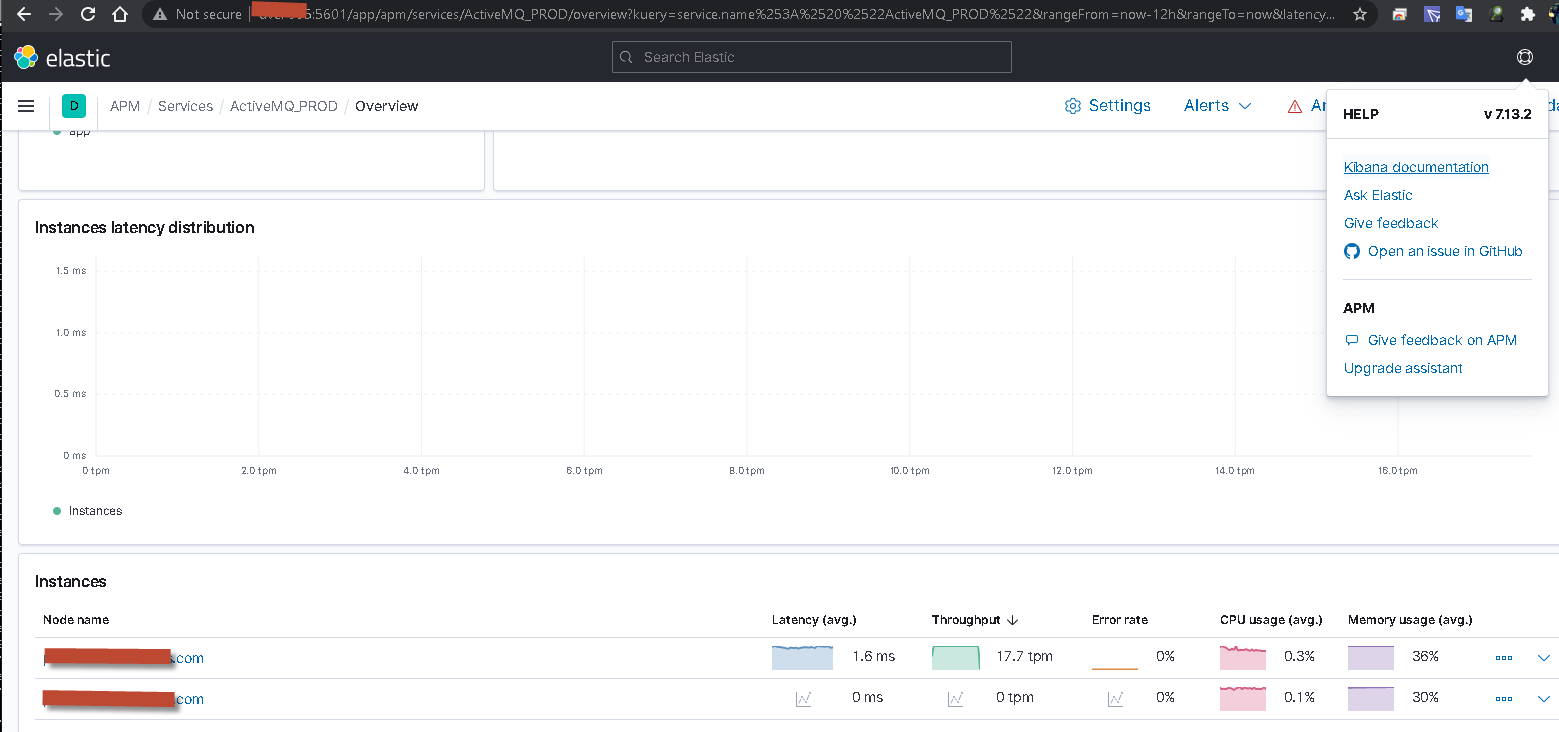
We are using 7.13.0 and we restore a snapshot from 7.7.1. Everything is working but we noticed that on Kibana APM Dashboard, the ActiveMQ Service has some servers that are not showing under Environment if there's no transactions. In Kibana 7.7.1, it will still show the servers. The other Java apps that has no transactions show all the servers under Environment.

Kibana 7.13.0 Missing server from Environment

Kibana 7.7.1

Kibana 7.13.0

Kibana 7.7.1

I just downloaded Elasticsearch, Logstash, Kibana, APM 7.13.2 and did a snapshot restore but still not seeing the other environment for ActiveMQ.

WebLogic, Tomcat and Plain java apps does not have this issue.

After checking all Services in APM, we just found out that it is not only happening to ActiveMQ but also for Tomcat, WebLogic and Plain Java apps.

15 days data and missing some servers under environment

7 days data and showing all servers under environment

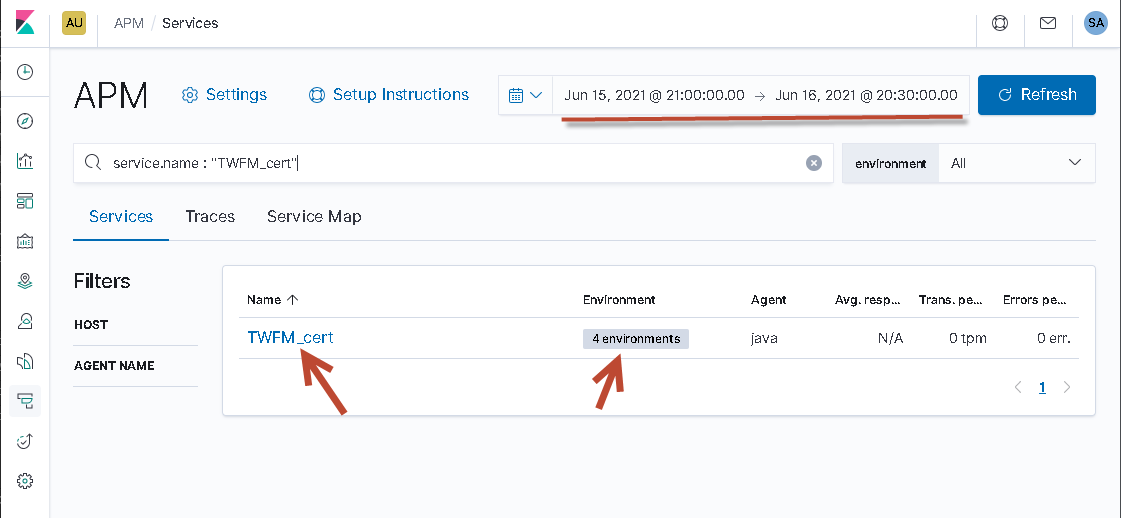
Not sure if this is how it should be (no transactions means will not show under environment) but we have some Services that have no data and still show full environments

15 minutes no data to some Services

7 days data of no data except for 1 Service

Hey @adsandie! Thanks for noticing this. The issue here is that we get environments from both transactions and metrics, but if transactions are available, we'll only use the environments from those. Only if there are no transactions for that service at all we'll fall back to using environments from metric documents. I've opened [APM] Merge environments from transactions/metrics for service overview · Issue #102692 · elastic/kibana · GitHub on our side so we can have a look.

Thank you. We have apps that are running active/passive so there will be no transactions to those passive but will still have jvm metrics

This topic was automatically closed 28 days after the last reply. New replies are no longer allowed.