Kibana creating indecs not working

Hello,

I have a fresh install of ELK + X-pack and for some reason Kibana doesn't want to create index for my data.

If I explore this URL http://elasticsearchurl:9200/_cat/indices I get:

green open .security-6 1ACQXZVzR-mmKpx-bjlpzA 1 0 3 0 10.5kb 10.5kb
yellow open .monitoring-es-6-2017.12.11 bdBlnT8bR1KoNKke_zOGMA 1 1 2834 188 1.7mb 1.7mb
yellow open .monitoring-kibana-6-2017.12.11 I1s68Y1YRpuwa-GxV8yzaA 1 1 162 0 186.3kb 186.3kb
yellow open .watches BvcTJl_eRHaBn2FmHiHW5w 1 1 5 0 33.4kb 33.4kb
yellow open metricbeat-2017.12.11 Mmnj1UD5QLqq-FLAW867qw 5 1 14480 0 5.6mb 5.6mb
yellow open .triggered_watches 5v_2YEZISfOeGDNFpamcYg 1 1 0 0 8.2kb 8.2kb
yellow open .kibana fr-A0g3aSXKDToCeMfQ7pg 1 1 194 19 534.4kb 534.4kb
yellow open **filebeat-2017.12.11** qo3NcqslSTOfCiZk3h-uHQ 1 1 28333 0 4.3mb 4.3mb
yellow open .monitoring-alerts-6 uZSYLUjzSHCd4maZZsgmIA 1 1 1 0 6.5kb 6.5kb
yellow open .watcher-history-6-2017.12.11 uHXXtAWLTgqN8050PMaSNw 1 1 252 0 319.9kb 319.9kb

If I try to create filebeat index, using this patern filebeat-* I get the error: Unable to fetch mapping. Do you have indices matching the pattern?

I get the same for metricbeat or filebeat, but it works for others like .monitoring-alerts.

I suspect that maybe the format of the filebeat or metricbeat are wrong, but the are produced by metricbeat and filebeat apps-beat so I don't know how to check this.

metricbeat version 6.0.0 (amd64), libbeat 6.0.0
filebeat version 6.0.1 (amd64), libbeat 6.0.1
Elasticsearch Version: 6.0.1
Kibana Version: 6.0.1

Metricbeat and Filebeat ar pushing the logs into elasticsearch directly

What could be wrong? What should I look for?

Thank you,
F

metricbeat index looks fine, but the filebeat one looks incorrect - it shouldn't have the ** on it. I just ran filebeat v 6.0.1 and my index was automatically named filebeat-6.0.1-2017.12.11. Perhaps there is an error in your filebeat.yml file?

Hello Stacey, the ** from my previous message was meant to make the filebeat look bold. In reality it look like this. filebeat-2017.12.11
these are some snippets of filebeat.yml config file which may be relevant

setup.template.name: "filebeat"
setup.template.pattern: "filebeat-*"
setup.template.fields: "/etc/filebeat/fields.yml"
setup.template.overwrite: true
setup.template.settings:
index.number_of_shards: 1
index.number_of_replicas: 1

output.elasticsearch:

Array of hosts to connect to.

enabled: true
hosts: ["elasticsearchserver:9200"]
index: "filebeat-%{+yyyy.MM.dd}"
max_retries: -1

Optional protocol and basic auth credentials.

#protocol: "https"
username: "elastic"
password: "password"

the thing is that, neither filebeat or metricbeat works in kibana, so I don't know what to try anymore. The last 4 days I spent trying to debug this thing and I just feel I should give up and move to graylog2.

What should I investigate to figure out what is happening?

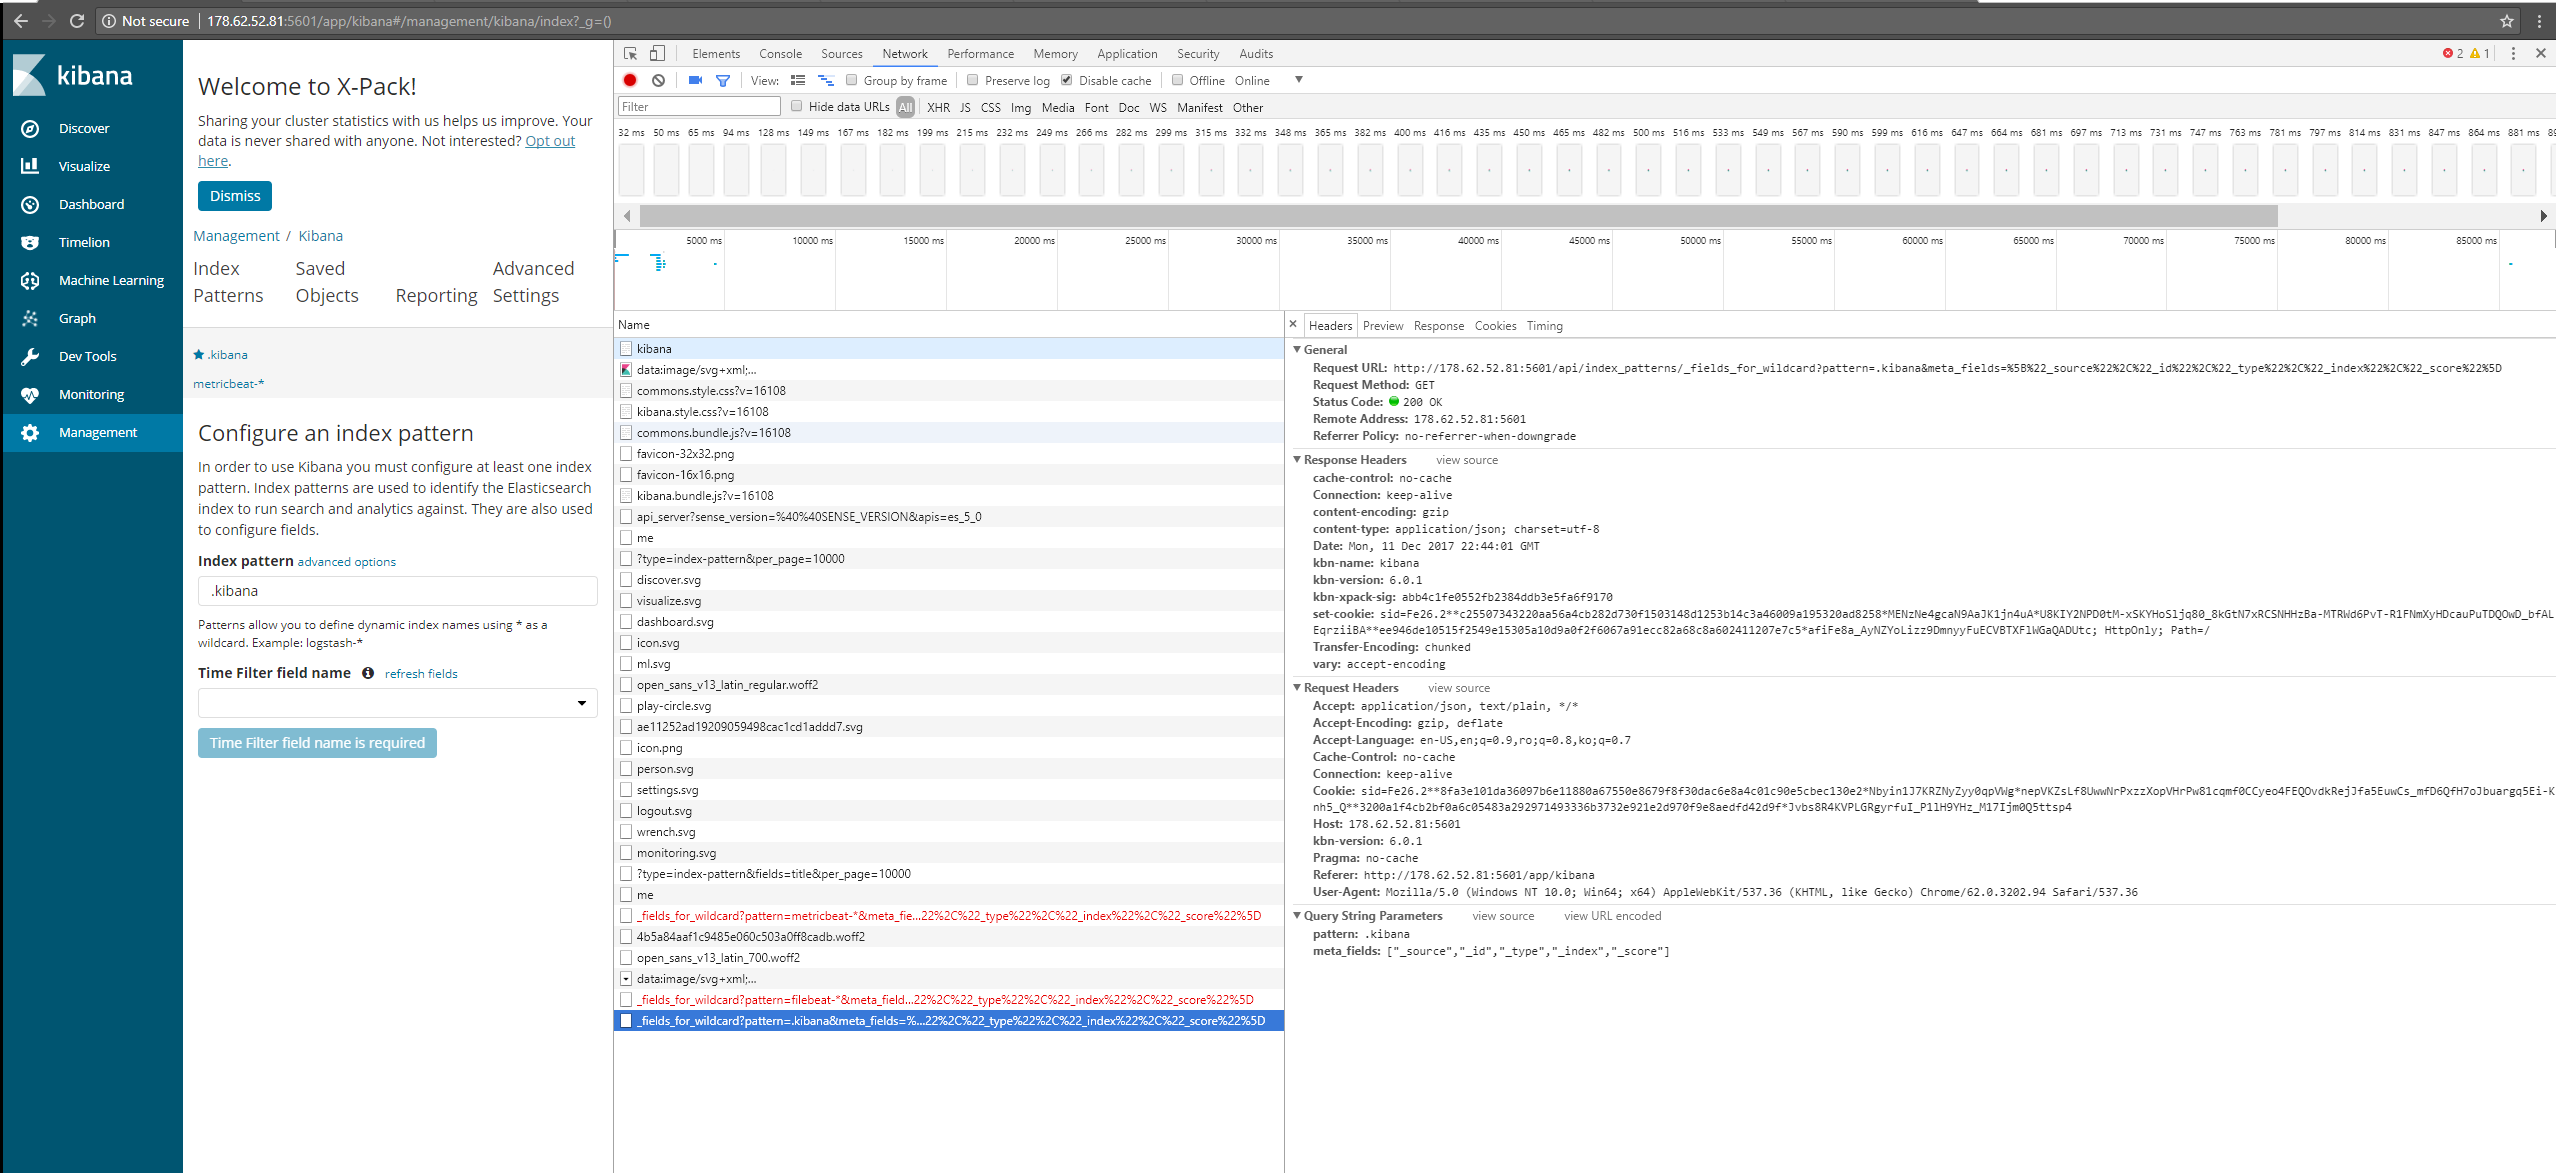
That is strange indeed. Can you open up developer tools and see if there are any console errors? Also can you inspect the network tab and post the failed request?

@chrisronline or @Bill_McConaghy - any idea what could be going on here?

Hello,

I get a 404 for metribeat-* and filebeat-*

If I try to do the same thing for .kibana index. it doesn't throw the 404 error.

If you turn on logging.verbose: true and restart the kibana server, can you post the output after querying for the index pattern?

Looks like this might be a legit bug, though I'm not able to repro.

Another thing we can check to rule out an issue with beats and narrow it down to a kibana issue - if you open dev tools and run this:

POST test-2017.12.11/data/_bulk
{ "index" : { } }
{  "query": "will this index",  "@timestamp": "2017-09-27T13:00:00.000Z" }

Can you then go into management and add an index pattern called test-*?

Thank you Stacey for helping with you with this issue.

if I run

POST test-2017.12.11/data/_bulk
{ "index" : { } }
{ "query": "will this index", "@timestamp": "2017-09-27T13:00:00.000Z" }

I get this:

{
"took": 0,
"errors": true,
"items": [
{
"index": {
"_index": "test-2017.12.11",
"_type": "data",
"_id": null,
"status": 403,
"error": {
"type": "security_exception",
"reason": "action [indices:admin/create] is unauthorized for user [kibana]"
}
}
}
]
}

there are a lot of logs generated - without anybody using kibana.

I cannot paste to much here, so I've put a link to a dropbox with a larger portion of the log file.

here is the link https://www.dropbox.com/s/b5obe4jvhbux20f/kibana.log?dl=0

if you want acces to the kibana server you can use this link:

http://178.62.52.81:5601
user kibana
password flaviu

I don't have any valuable data there, so you can test whatever you want

I can also give you access to ssh if it may help to investigate.

Thanks,

I believe it was just a permission issue.

I have created a user running the following 2 commands:

curl -XPOST -u elastic 'elasticsearchServerIp:9200/_xpack/security/role/events_admin' -H "Content-Type: application/json" -d '{
"indices" : [
{
"names" : [ "metricbeat-" ],
"privileges" : [ "all" ]
},
{
"names" : [ ".kibana
" ],
"privileges" : [ "manage", "read", "index" ]
}
]
}'

and

curl -XPOST -u elastic 'elasticsearchServerIp:9200/_xpack/security/user/username' -H "Content-Type: application/json" -d '{
"password" : "password",
"full_name" : "user name",
"email" : "email@domain.com",
"roles" : [ "events_admin" ]
}'

and now I can create the index metricbeat-*.

Initially I was authenticating with the Kibana user instead of elastic user.
I am not sure if this should be the normal/expected behavior if you use the standard created user Kibana.

if this is the normal behavior, PLEASE add a more relevant error message. Like, the user doesn't have permission to add the index.

Please let me know if you want to investigate more.

Thank you,

f

This topic was automatically closed 28 days after the last reply. New replies are no longer allowed.