Kibana dashboards for MySQL seem meaningless

I'm still testing everything out, this is a screenshot of Kibana 6.4 charting MySQL usage on 2 docker instances and one separate server, using Metricbeat 6.4 on each server (well, there is a single docker container monitoring both MySQL containers).

The docker instances combined do 6 reads every minute.

The standalone server does 10 inserts a minute every 5 minutes.

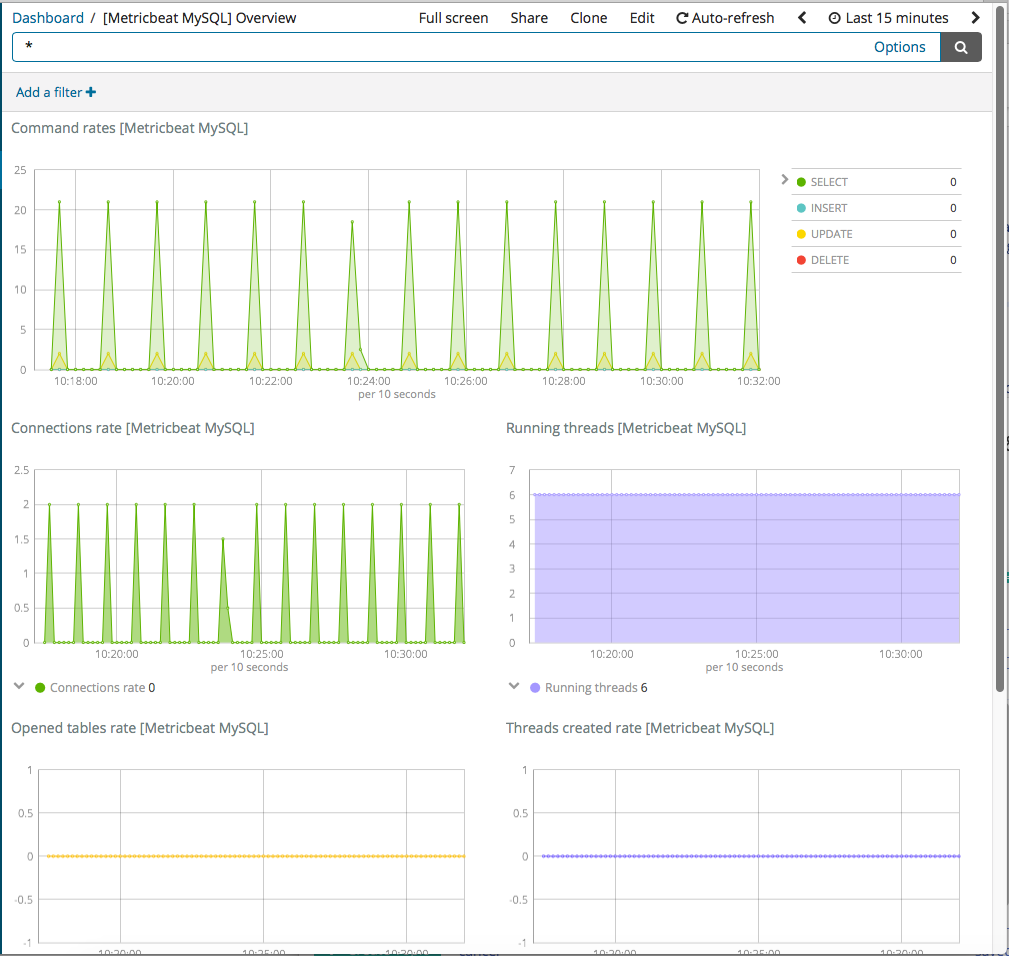
So, the connections rate, the opened tables rate, and the sent/received bytes rates don't seem remotely correct, especially when they oscillate into the negatives like they do.

This is what I'm seeing:

This is what I see when I look at the it running locally in VirtualBox (which seems a LOT more inline with what I would expect from the deployed instance)

The only thing I can think of (and this is just dawning on me), the Docker instances are running MariaDB latest, whereas the standalone server is running an old MySQL (version 5.7); could that old of a MySQL install be sending gibberish to Metricbeat?

Hey @lucasjkr, I moved this to the Metricbeat section so the more knowledgeable people over there can chime-in.

Hi @lucasjkr :slight_smile:

Please, can you also tell us what exact version of MariaDB you are using? Do you mean latest tag of Docker according to today?

Also, the orchestrator of the containers, is it Docker Swarm, CoreOS, K8s?

I just want to try to reduce the scope of the problem a bit more.

Hello Mario! Thanks for responding. Here is everything I can think of that's relevant.

On my local setup, everything runs in Docker, but no orchestration (i haven't gotten that far yet), it's all tied together just with Docker Compose.

All Elastic Components are now at 6.4.0

There are two MariaDB instances, each is: mariadb:10.3.8-bionic

There is one Metricbeat container that monitors both Maria instances, and everything works fine (that's the second screen capture).

I then deployed this same config to a cloud server, and again, everything is fine.

Then, I wanted to start gathering external metrics, because that's the next step, so I looked to an old test VPS i still had running and figured I would try with that one. It's Ubuntu 16.04, and MySQL 5.7. I installed Metricbeat 6.4, and once I started that service, that's where everything goes crazy, showing thousands of queries per interval, positive numbers, negative numbers, etc.

I have since turned off Metricbeat, and the numbers are back down to more reasonable numbers. So I think it's something to do with that old version of MySQL; that MySQL version is 5.7.21-0ubuntu0.16.04.1

In a day or two, Im going to update that server to MariaDB 10.3.8, and will startup the metricbeat service again and let you know what the results are. But any other ideas would be nice too!

Follow up; there is not a single byte on the server with MySQL 5.7 on it; if you or your team want access to it, I'm more than happy to accommodate. Just an offer.

This topic was automatically closed 28 days after the last reply. New replies are no longer allowed.