Docker module seems stopped working

The normal size of a day's Metricbeat data is about 1.8GB. However, yesterday's docs count dropped in half.
Also, the Docker panel in Kibana Infra says " There is no data to display." after 3 PM yesterday. So I guess the Docker module stopped working.

My metricbeat runs on Kubernetes, following the guide here(https://www.elastic.co/guide/en/beats/metricbeat/current/running-on-kubernetes.html). All the Elastic Stack aligned at 6.6.0. I tried to restart the daemonset( the daemon set collects kubernetes and docker data, see the YAML file in the link), but there is still no docker data after restarting.

Metricbeat is working from the events rate in monitoring(the blank is due to restart):

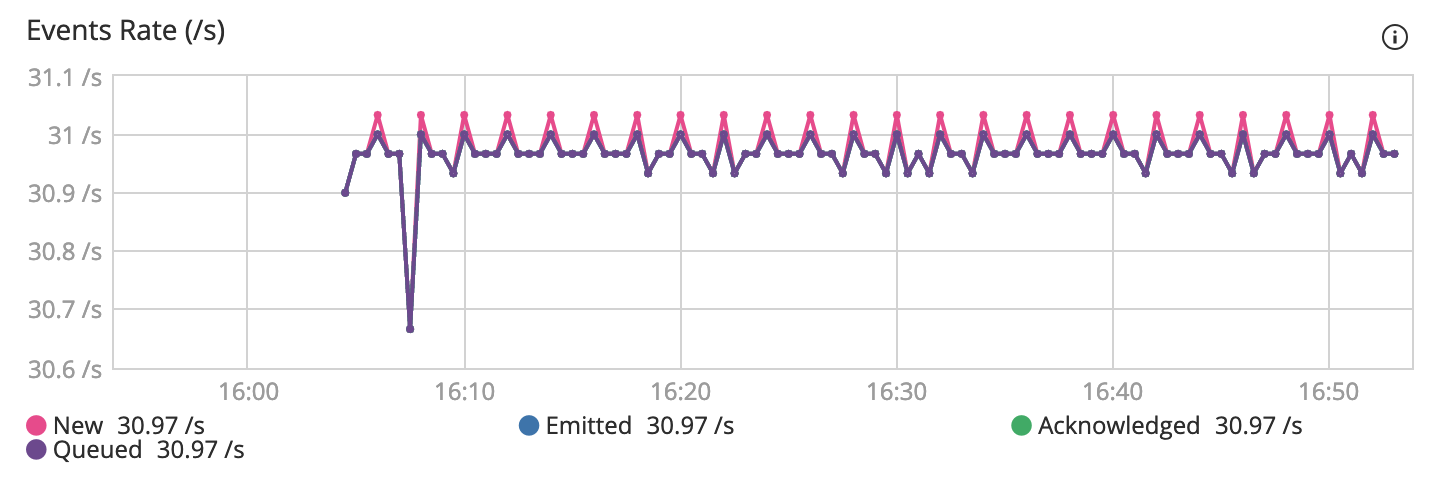
So it looks like the other module is working but the docker module failed.

What can I do to solve the problem?

Weird. There are still fresh documents. But the data won't show in Infra.

Hello @fr0der1c, so metrics are still flowing in just fine but no data showing up in infrastructure Kibana UI? Is there any error message in kibana log by any chance?

Hi @Kaiyan_Sheng,
The problem somehow disappeared today. The infra UI works fine and the storage size of Metricbeat goes back to a normal number:

I don't think the metrics were flowing in fine yesterday. As you can see, the storage size of 18th Feb. is only more than half compared to normal size. I checked the Kibana log, nothing special here.

Good to know! For the metrics flowing issue, maybe it's worth trying to check what time range it's missing data and then go check the logs(ES, metricbeat) to see if there's anything unusual at that time?

This topic was automatically closed 28 days after the last reply. New replies are no longer allowed.