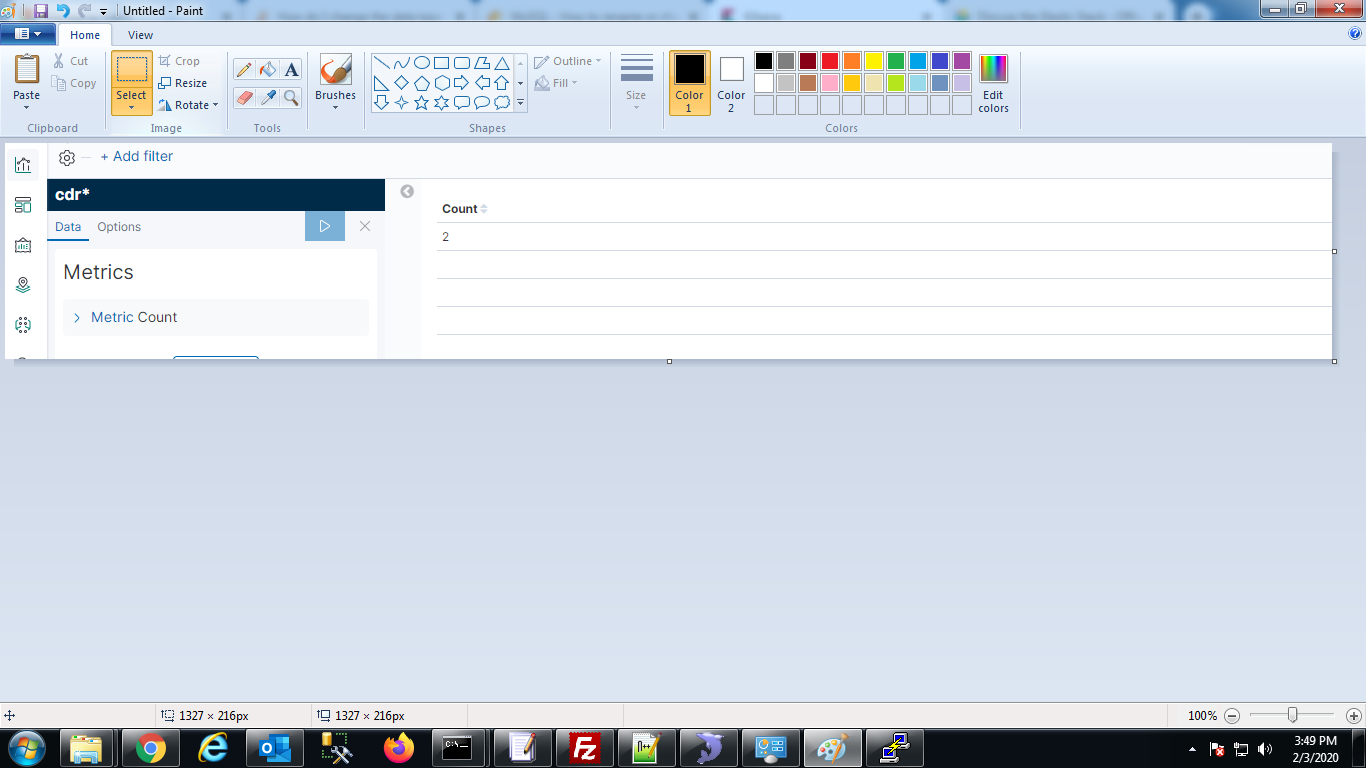
I have make mysql connectivity with ELK Stack. I have parsed data through logstash, Data is loaded in kibana. Index mangement shows that the index have 100 records for example when i make visualization for this index only 2 records is showing
this is the index which is showing total number of records parse in kibana. in this image only 2 records is showing please help in this regards
It's not showing in your screenshot but in the top right there is a time filter. By default is is set to the last 15 minutes. Could you try expanding the time range there? Then your data should show up. Let me know whether that helps.

Please make sure the index pattern has the correct field defined as the primary time field to filter on. Also please check whether all of your documents have a valid value in this field - if for example the date of a document couldn't be parsed and is undefined or a string, it wouldn't show up at all.