Hi Elastic team,
I'm using Elastic Stack 7.2.0.
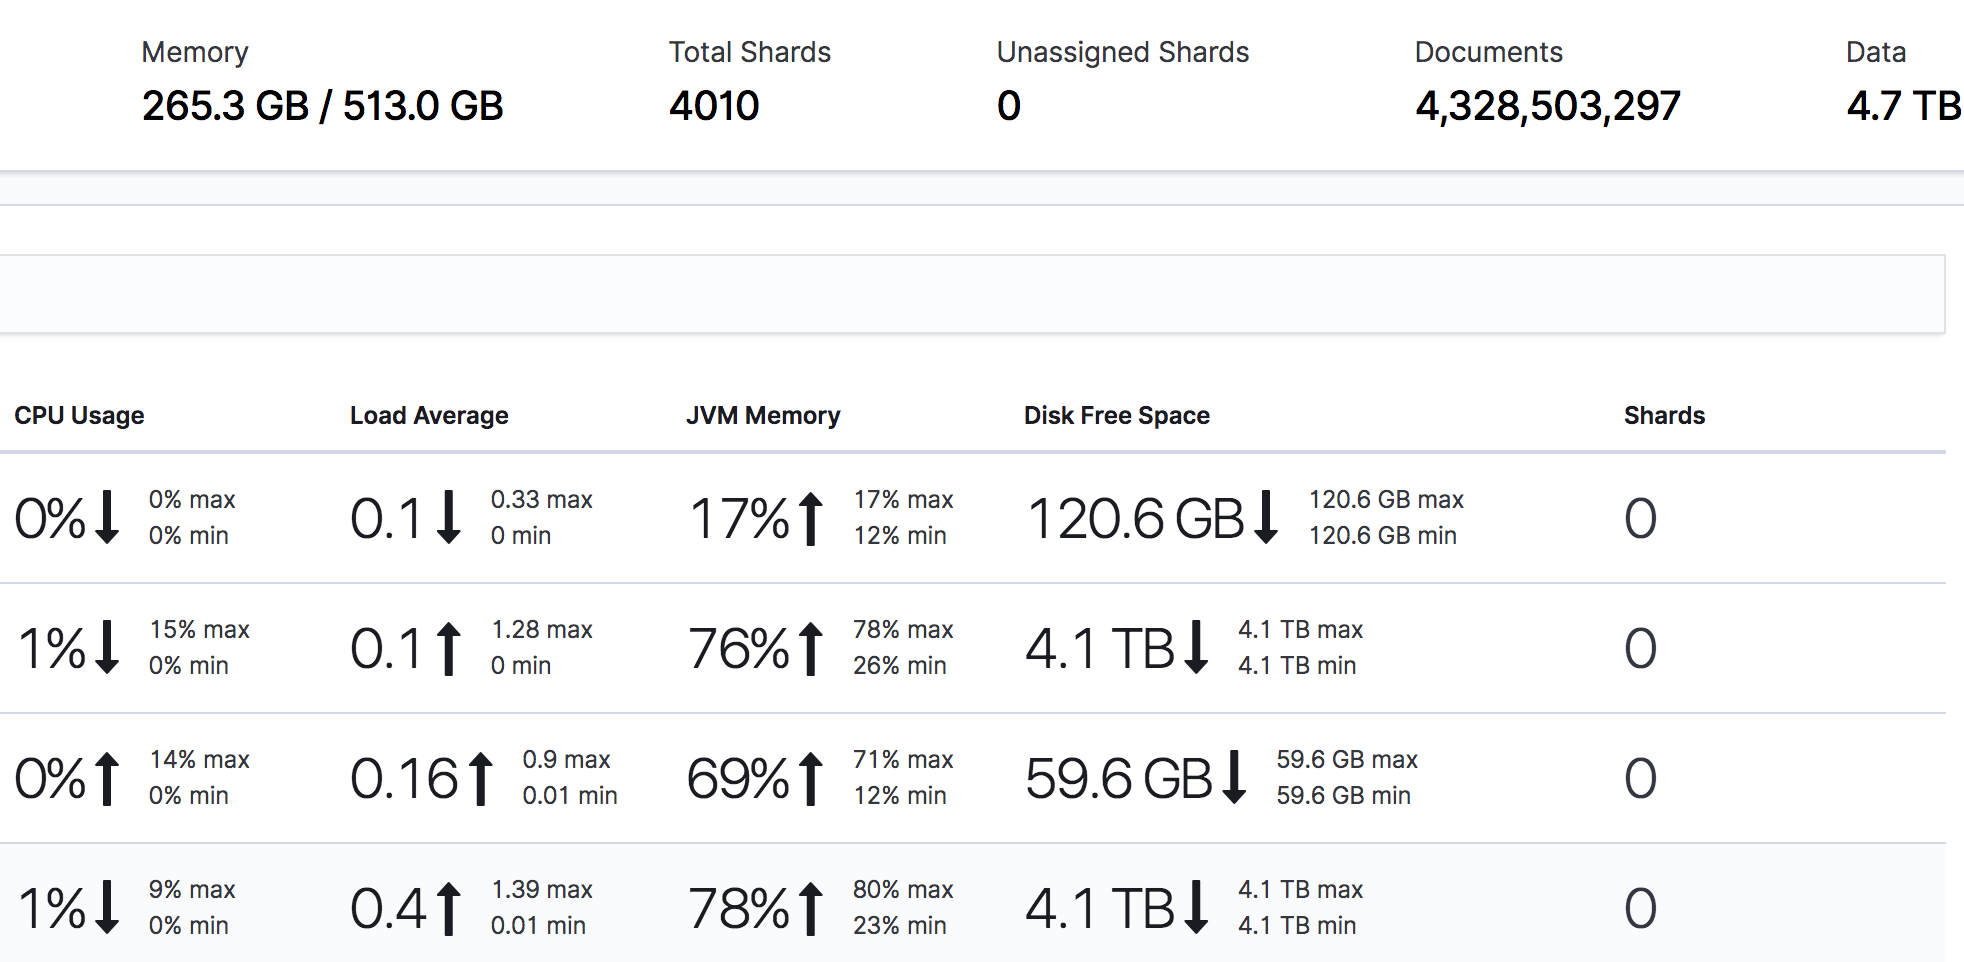
Kibana displays zero shards for each node in the monitoring tab.
But it can display total shards correctly.
What is the problem?
Are they data nodes?
Yes, I have 12 data nodes. 9 for hot and 3 for warm.
Hi @worapojc,
We retrieve information about shards from a certain type of document (type=shards) in .monitoring-es-* indices.
Let's run a query to get a better sense of what that data looks like in your system. I'm assuming you're only monitoring a single cluster, and that you're seeing these issues still. If either of those are untrue, we'll need to adjust the query slightly, but otherwise run this and report back on the results:
POST .monitoring-es-*/_search
{
  "size": 0,
  "query": {
    "bool": {
      "filter": [
        {
          "term": {
            "type": {
              "value": "shards"
            }
          }
        },
        {
          "range": {
            "timestamp": {
              "gte": "now-1h"
            }
          }
        }
      ]
    }
  },
  "aggs": {
    "nodes": {
      "terms": {
        "field": "shard.node",
        "size": 10000
      }
    }
  }
}
Hi @chrisronline, here is the result.
{
  "took" : 65,
  "timed_out" : false,
  "_shards" : {
    "total" : 16,
    "successful" : 16,
    "skipped" : 0,
    "failed" : 0
  },
  "hits" : {
    "total" : {
      "value" : 10000,
      "relation" : "gte"
    },
    "max_score" : null,
    "hits" : [ ]
  },
  "aggregations" : {
    "nodes" : {
      "doc_count_error_upper_bound" : 0,
      "sum_other_doc_count" : 0,
      "buckets" : [
        {
          "key" : "7DxPvJW4QAm_TrmY9UOXjg",
          "doc_count" : 177235
        },
        {
          "key" : "LIwkxHZSTe61eFOcDmjAbw",
          "doc_count" : 158810
        },
        {
          "key" : "LcwOpRiSQny_ax7bgYUTUQ",
          "doc_count" : 155615
        },
        {
          "key" : "Z35hmlz_Q2GAGhmLJRAO4w",
          "doc_count" : 70706
        },
        {
          "key" : "TdgJhD7DSzS-gYN0Tr6qkA",
          "doc_count" : 68855
        },
        {
          "key" : "P68fR5riQ72V5rLyfoidBQ",
          "doc_count" : 50162
        },
        {
          "key" : "3i6_-lw3RdK0CDxSaueYXg",
          "doc_count" : 36630
        },
        {
          "key" : "4MqQ-MR9RKyT81-KzFC2hQ",
          "doc_count" : 36630
        },
        {
          "key" : "FRsLS5v4RmiN1s1WgSA5Pw",
          "doc_count" : 36630
        },
        {
          "key" : "05NFJrtBSJOUlTfaunJ-vQ",
          "doc_count" : 36580
        },
        {
          "key" : "je3jrr1cT8e4_5za6MhsfQ",
          "doc_count" : 36538
        },
        {
          "key" : "YMH2mvQ_QuSYOJz_IlAEaQ",
          "doc_count" : 36533
        },
        {
          "key" : "LcHh6zNFSNmm8PiD27yXRA",
          "doc_count" : 36445
        },
        {
          "key" : "QRs7ZpxqRwCuLiK-n2DDJw",
          "doc_count" : 36445
        },
        {
          "key" : "LDkWZ9O9T1KazwDidZudIA",
          "doc_count" : 36401
        }
      ]
    }
  }
}
I noticed that there is zero shard in the document with shards type.
     {
        "_index" : ".monitoring-es-7-2019.08.16",
        "_type" : "_doc",
        "_id" : "IMoJ84inSD-ifycLpRKATg:FRsLS5v4RmiN1s1WgSA5Pw:a202171-windows_event_log-2019.33:0:p",
        "_score" : 1.0236014,
        "_source" : {
          "cluster_uuid" : "z_eKGqwoTV6H6cOaf5__Ow",
          "timestamp" : "2019-08-16T03:49:28.397Z",
          "interval_ms" : 10000,
          "type" : "shards",
          "source_node" : {
            "uuid" : "FRsLS5v4RmiN1s1WgSA5Pw",
            "host" : "10.49.116.247",
            "transport_address" : "10.49.116.247:9300",
            "ip" : "10.49.116.247",
            "name" : "10.49.116.247",
            "timestamp" : "2019-08-16T03:49:28.246Z"
          },
          "state_uuid" : "IMoJ84inSD-ifycLpRKATg",
          "shard" : {
            "state" : "STARTED",
            "primary" : true,
            "node" : "FRsLS5v4RmiN1s1WgSA5Pw",
            "relocating_node" : null,
            "shard" : 0,
            "index" : "a202171-windows_event_log-2019.33"
          }
        }
      }
I configured the data cluster to send the monitoring by xpack monitoring.
xpack.security.enabled: false
xpack.monitoring.enabled: true
xpack.monitoring.collection.enabled: true
xpack.monitoring.exporters:
    id1:
        type: http
        host: <list of montior hosts>
I also disabled xpack monitoring on the monitoring cluster, what's the cause of this issue?
Hi, Do you have any ideas on this? The issue still occurs.
Hi @worapojc,
I think it'll help if you generate a .har file so I can inspect the response of the api calls to Kibana server.
Can you please follow these steps and ensure you start recording the HAR before loading the nodes listing page, then stopping the recording once it's loaded and you see the familiar error scenario illustrated in your original post, then share it here?
Thanks Chris. I uploaded HA file here, https://www.dropbox.com/s/90m2gvmnf5xncv8/elasticsearch-cluster.ha?dl=0.
Thanks so much for the information @worapojc!
Let's circle back and run another query that might tell us a little more about a possible issue:
 POST .monitoring-es-*/_search
{
  "size": 0,
  "query": {
    "bool": {
      "filter": [
        {
          "term": {
            "type": {
              "value": "shards"
            }
          }
        },
        {
          "range": {
            "timestamp": {
              "gte": "now-1h"
            }
          }
        }
      ]
    }
  },
  "aggs": {
    "nodes": {
      "terms": {
        "field": "shard.node",
        "size": 10000
      },
      "aggs": {
        "index_count": {
          "cardinality": {
            "field": "shard.index"
          }
        },
        "node_names": {
          "terms": {
            "field": "source_node.name",
            "size": 10
          }
        },
        "node_ids": {
          "terms": {
            "field": "source_node.uuid",
            "size": 1
          }
        }
      }
    }
  }
}
Thanks for your patience!
Thanks Chris.
The execution result is https://www.dropbox.com/s/ws4vvlqavvu676d/monitoring-es.txt?dl=0.
(Sorry, I cannot post the result in the thread)
Thanks again @worapojc.
All of this data looks fine so I'm wondering if there is a disconnect between the cluster_stats and the node_stats documents . I'm going to ask you to run a couple more queries to just give me a complete picture. I apologize for all this back and forth and I thank you for your patience.
Query 1:
POST .monitoring-es-*/_search
{
  "query": {
    "bool": {
      "filter": [
        {
          "term": {
            "type": "cluster_stats"
          }
        },
        {
          "range": {
            "timestamp": {
              "gte": "now-1h"
            }
          }
        }
      ]
    }
  },
  "collapse": {
    "field": "cluster_uuid"
  },
  "sort": {
    "timestamp": {
      "order": "desc"
    }
  }
}
Query 2:
POST .monitoring-es-*/_search
{
  "sort": {
    "timestamp": {
      "order": "desc"
    }
  },
  "query": {
    "bool": {
      "filter": [
        {
          "term": {
            "type": "shards"
          }
        }
      ]
    }
  },
  "collapse": {
    "field": "cluster_uuid",
    "inner_hits": {
      "name": "by_state_uuid",
      "size": 1000,
      "collapse": {
        "field": "state_uuid"
      }
    }
  },
  "aggs": {
    "indices": {
      "terms": {
        "field": "shard.index",
        "size": 10000
      },
      "aggs": {
        "states": {
          "terms": {
            "field": "shard.state",
            "size": 10
          },
          "aggs": {
            "primary": {
              "terms": {
                "field": "shard.primary",
                "size": 2
              }
            }
          }
        }
      }
    },
    "nodes": {
      "terms": {
        "field": "shard.node",
        "size": 10000
      },
      "aggs": {
        "index_count": {
          "cardinality": {
            "field": "shard.index"
          }
        },
        "node_names": {
          "terms": {
            "field": "source_node.name",
            "size": 10
          }
        },
        "node_ids": {
          "terms": {
            "field": "source_node.uuid",
            "size": 1
          }
        }
      }
    }
  }
}
Thanks Chris.
Query 1 result.
{
  "took" : 11689,
  "timed_out" : false,
  "_shards" : {
    "total" : 7,
    "successful" : 7,
    "skipped" : 0,
    "failed" : 0
  },
  "hits" : {
    "total" : {
      "value" : 0,
      "relation" : "eq"
    },
    "max_score" : null,
    "hits" : [ ]
  }
}
For Query 2, firstly, I tried to query it through Kibana Dev Tool. I got the 504 Gateway Timeout.
So, I ssh to a node in the monitoring cluster to run the query.
Query 2 response.
{"error":{"root_cause":[{"type":"too_many_buckets_exception","reason":"Trying to create too many buckets. Must be less than or equal to: [10000] but was [10001]. This limit can be set by changing the [search.max_buckets] cluster level setting.","max_buckets":10000},{"type":"too_many_buckets_exception","reason":"Trying to create too many buckets. Must be less than or equal to: [10000] but was [10001]. This limit can be set by changing the [search.max_buckets] cluster level setting.","max_buckets":10000},{"type":"too_many_buckets_exception","reason":"Trying to create too many buckets. Must be less than or equal to: [10000] but was [10001]. This limit can be set by changing the [search.max_buckets] cluster level setting.","max_buckets":10000},{"type":"too_many_buckets_exception","reason":"Trying to create too many buckets. Must be less than or equal to: [10000] but was [10001]. This limit can be set by changing the [search.max_buckets] cluster level setting.","max_buckets":10000},{"type":"too_many_buckets_exception","reason":"Trying to create too many buckets. Must be less than or equal to: [10000] but was [10001]. This limit can be set by changing the [search.max_buckets] cluster level setting.","max_buckets":10000},{"type":"too_many_buckets_exception","reason":"Trying to create too many buckets. Must be less than or equal to: [10000] but was [10001]. This limit can be set by changing the [search.max_buckets] cluster level setting.","max_buckets":10000},{"type":"too_many_buckets_exception","reason":"Trying to create too many buckets. Must be less than or equal to: [10000] but was [10001]. This limit can be set by changing the [search.max_buckets] cluster level setting.","max_buckets":10000}],"type":"search_phase_execution_exception","reason":"all shards failed","phase":"query","grouped":true,"failed_shards":[{"shard":0,"index":".monitoring-es-7-2019.08.22","node":"G64ePxYQQKWs4nwaZn0ZqA","reason":{"type":"too_many_buckets_exception","reason":"Trying to create too many buckets. Must be less than or equal to: [10000] but was [10001]. This limit can be set by changing the [search.max_buckets] cluster level setting.","max_buckets":10000}},{"shard":0,"index":".monitoring-es-7-2019.08.23","node":"G64ePxYQQKWs4nwaZn0ZqA","reason":{"type":"too_many_buckets_exception","reason":"Trying to create too many buckets. Must be less than or equal to: [10000] but was [10001]. This limit can be set by changing the [search.max_buckets] cluster level setting.","max_buckets":10000}},{"shard":0,"index":".monitoring-es-7-2019.08.24","node":"G64ePxYQQKWs4nwaZn0ZqA","reason":{"type":"too_many_buckets_exception","reason":"Trying to create too many buckets. Must be less than or equal to: [10000] but was [10001]. This limit can be set by changing the [search.max_buckets] cluster level setting.","max_buckets":10000}},{"shard":0,"index":".monitoring-es-7-2019.08.25","node":"G64ePxYQQKWs4nwaZn0ZqA","reason":{"type":"too_many_buckets_exception","reason":"Trying to create too many buckets. Must be less than or equal to: [10000] but was [10001]. This limit can be set by changing the [search.max_buckets] cluster level setting.","max_buckets":10000}},{"shard":0,"index":".monitoring-es-7-2019.08.26","node":"M2PUPxsTRXiKeu3gNokLYw","reason":{"type":"too_many_buckets_exception","reason":"Trying to create too many buckets. Must be less than or equal to: [10000] but was [10001]. This limit can be set by changing the [search.max_buckets] cluster level setting.","max_buckets":10000}},{"shard":0,"index":".monitoring-es-7-2019.08.27","node":"M2PUPxsTRXiKeu3gNokLYw","reason":{"type":"too_many_buckets_exception","reason":"Trying to create too many buckets. Must be less than or equal to: [10000] but was [10001]. This limit can be set by changing the [search.max_buckets] cluster level setting.","max_buckets":10000}},{"shard":0,"index":".monitoring-es-7-2019.08.28","node":"G64ePxYQQKWs4nwaZn0ZqA","reason":{"type":"too_many_buckets_exception","reason":"Trying to create too many buckets. Must be less than or equal to: [10000] but was [10001]. This limit can be set by changing the [search.max_buckets] cluster level setting.","max_buckets":10000}}]},"status":503}
How do I fix the error above?
Ah. Are you seeing those errors in the Kibana or ES log file when you try and visit the nodes page?
It returned from curl command.
curl -s -H "Content-Type: application/json" -XPOST http://localhost:9200/.monitoring-es-*/_search -d '<Query 2>'
I think you're running into https://github.com/elastic/kibana/issues/36892. There is a band-aid fix available soon that should help you. In the mean, increase the search.max_buckets cluster setting. More about that setting
Thank you for help. I'll wait the patch or new version to fix this issue. 
© 2020. All Rights Reserved - Elasticsearch
Apache, Apache Lucene, Apache Hadoop, Hadoop, HDFS and the yellow elephant logo are trademarks of the Apache Software Foundation in the United States and/or other countries.