Hello,
I am sure it has been asked million times but I couldn't find a solution for myself after hours of browsing.
I created an index in elasticsearch
PUT /coronavirus
{
  "settings" : {
        "number_of_shards" : 2

    },
  "mappings": {
      "properties": {
        "@timestamp": {
          "type": "date",
          "format": "date_hour_minute_second"
            },
        "Active_Cases": {
          "type": "float"
        },
        "Country": {
          "type": "text"

        },
        "Serious_Critical": {
          "type": "float"
        },
        "Tests_1M_POP": {
          "type": "float"

        },
        "Tot_Cases_1M_POP": {
          "type": "float"
        },
        "Tot_Deats_1M_POP": {
          "type": "float"
        },
        "Total_Cases": {
          "type": "float"
        },
        "Total_Deaths": {
          "type": "float"
        },
        "Total_Recovered": {
          "type": "float"

      }
    }
  }
}
The data mapping is correctly displayed when i import data through a python script using elasticsearch module everythin is fine.
If i query GET /coronavirus/_search
I get the correct response with data:
{
  "took" : 2,
  "timed_out" : false,
  "_shards" : {
    "total" : 2,
    "successful" : 2,
    "skipped" : 0,
    "failed" : 0
  },
  "hits" : {
    "total" : {
      "value" : 218,
      "relation" : "eq"
    },
    "max_score" : 1.0,
    "hits" : [
      {
        "_index" : "coronavirus",
        "_type" : "_doc",
        "_id" : "2o1JX3EBirWBsboeoYXp",
        "_score" : 1.0,
        "_source" : {
          "@timestamp" : "2020-04-09T15:13:13",
          "Country" : "Europe",
          "Total_Cases" : 757450.0,
          "Total_Deaths" : 62412.0,
          "Total_Recovered" : 174392.0,
          "Active_Cases" : 520646.0,
          "Serious_Critical" : 30515.0,
          "Tot_Cases_1M_POP" : 0.0,
          "Tot_Deats_1M_POP" : 0.0,
          "Tests_1M_POP" : 0.0
        }
      },
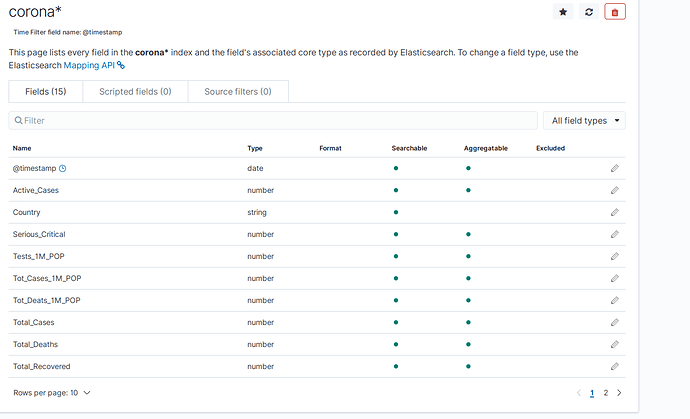
I create the index in Kibana and is correctly recognised with right fields and types:
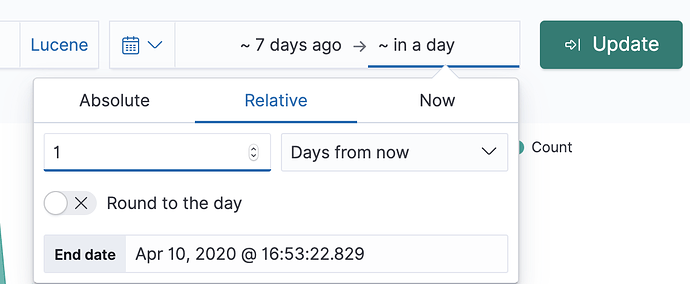
When i try to discover data in Kibana i can't see anything I extended the time range for 1 year even if data just recently inserted.
Thanks a lot for any suggestions.
Best Regards,


