Hello there,
Iam trying to make my Data visible in the Discover Tab of Kibana and it's just not working out for me.
Iam sitting on a project for my studies and built a weather station. The station submits its data once a minute to the elastic search database:
    --header 'Authorization: Basic hello' \
    --header 'Content-Type: application/json' \
    --data-raw '{
        "properties": {
            "humidity": "80.8926024542",
            "pressure": "999.55501023",
            "temperature": "-2.26",
            "@timestamp": "2021-01-29T13:30:01+01:00"
        }
    }'
I put elastic search behind a reverse proxy, thats why there is a basic auth.
The cluster happily acknowledges this and the entry is visible in elastic:
    "_index": "weather-test",
                    "_type": "_doc",
                    "_id": "tyIkTncBVIHFgv-pcAnD",
                    "_score": 1.0,
                    "_source": {
                        "properties": {
                            "humidity": 72.6349751508,
                            "pressure": 995.37218785,
                            "temperature": 0.33,
                            "@timestamp": "2021-01-29T13:35:46+01:00"
                        }
                    }
                }
The Mapping looks as follows:
    {

        "weather-test": {

            "mappings": {

                "properties": {

                    "@timestamp": {

                        "type": "date",

                        "format": "date_optional_time"

                    },

                    "humidity": {

                        "type": "double"

                    },

                    "pressure": {

                        "type": "double"

                    },

                    "properties": {

                        "properties": {

                            "@timestamp": {

                                "type": "date"

                            },

                            "humidity": {

                                "type": "float"

                            },

                            "pressure": {

                                "type": "float"

                            },

                            "temperature": {

                                "type": "float"

                            }

                        }

                    },

                    "temperature": {

                        "type": "double"

                    }

                }

            }

        }

    }
The problem is, that no amount of filtering or tinkering around shows a result in Discover. Here is the request that it sends:
    {
      "version": true,
      "size": 500,
      "sort": [
        {
          "@timestamp": {
            "order": "desc",
            "unmapped_type": "boolean"
          }
        }
      ],
      "aggs": {
        "2": {
          "date_histogram": {
            "field": "@timestamp",
            "calendar_interval": "1w",
            "time_zone": "Europe/Berlin",
            "min_doc_count": 1
          }
        }
      },
      "stored_fields": [
        "*"
      ],
      "script_fields": {},
      "docvalue_fields": [
        {
          "field": "@timestamp",
          "format": "date_time"
        },
        {
          "field": "properties.@timestamp",
          "format": "date_time"
        }
      ],
      "_source": {
        "excludes": []
      },
      "query": {
        "bool": {
          "must": [],
          "filter": [
            {
              "match_all": {}
            },
            {
              "range": {
                "@timestamp": {
                  "gte": "2020-01-29T13:02:42.164Z",
                  "lte": "2021-01-29T13:02:42.164Z",
                  "format": "strict_date_optional_time"
                }
              }
            }
          ],
          "should": [],
          "must_not": []
        }
      },
      "highlight": {
        "pre_tags": [
          "@kibana-highlighted-field@"
        ],
        "post_tags": [
          "@/kibana-highlighted-field@"
        ],
        "fields": {
          "*": {}
        },
        "fragment_size": 2147483647
      }
    }
And the response:
    {
      "took": 849,
      "timed_out": false,
      "_shards": {
        "total": 1,
        "successful": 1,
        "skipped": 0,
        "failed": 0
      },
      "hits": {
        "total": 0,
        "max_score": null,
        "hits": []
      },
      "aggregations": {
        "2": {
          "buckets": []
        }
      }
    }
The elasticsearch server and kibana is running on the same server, a raspberry pi 4 with 4gb ram and the resources arent exhausted in any way.
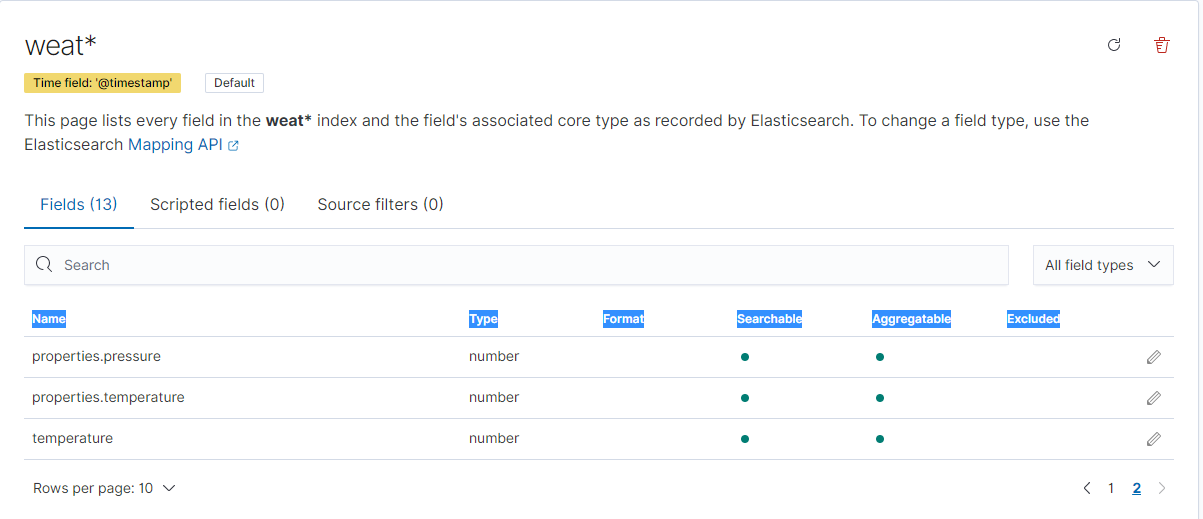
I also have an index pattern where @timestamp is recognized as a timestamp with the type of date. Its searchable and Aggregatable. With the exception of the timestamp feature this applies also the pressure, humidity and temperature.