Hello team.
I'm experiencing an issue with applications observability (APM). When I select this section with a filter for the last 15 minutes , in some cases, it only displays the following error.
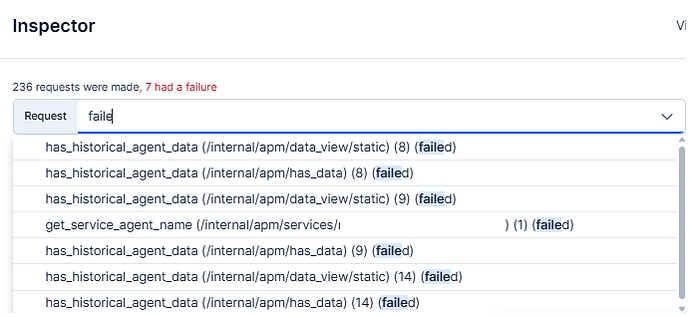
I turned on InspectEsQueries, and it showed me the following errors.
I tried testing with the Search Profiler, but it always returned a timeout.
I have a cluster on kubernetes with 3 hot nodes and 1 warm node:
For the datastream "traces-apm-default," it has 2 primary shards and 1 replica in the hot phase, with a maximum primary shard size of 25 GB in ILM. It spends 40 minutes in the hot phase before moving to the warm phase with 0 replicas and remains in the warm phase for 3 days. I have 3 or 4 indices per day.
For the moment, I am using Elasticsearch 9.0.0 only for traces, with the default templates.
Can you help me?


