Hello,
Getting this error on Kibana graph is I select the period higher than 5 days (probably too many datapoints):
Tried increasing elasticsearch.requestTimeout: 900000 (and restarted kibana service) but this message continues to appear after 30 seconds.
How can I solve this?
PS. Kibana version is 8.5.2.
Best Regards,
Mihai Radulescu
Hi @mihai.radulescu,
It looks like investigating the slow query to identify what is going on is your best bet. If you have the id of your visualisation you can use the Elasticsearch slow log. Or you can pull the query for the visualization via the inspect feature in Kibana and then run the query using the search profiler.
Both of these approaches are documented in this blog post for you to follow along.
Let us know if that helps!
Hi Carly,
Thank you very much for these links, much appreciate. Unfortunately I may be a noob and I have to ask some further clarifying questions:
- It seems that I don't have the Inspect section, despite the fact that "Inspect ES queries" is enabled:
(I even tried to restart kibana after enabling this).
- I have installed APM:
but if I go to Observability->APM, it doesn't show any data:
"Add data" will bring me to previous screen.
If I go to inspect, all results are 0:
Please help me further setting these up.
Best Regards,
Mihai Radulescu
Hi @mihai.radulescu,
Appreciate the update. I've got some clarifications to your additional questions:
I see later on a screenshot for the Inspector with the stats and requests tabs that suggests you have access to the Inspector. To confirm, I'm referring to the Inspect feature available in edit mode for a visualisation:
I would have a look at the request tab, where you should be able to either view the request in the search profiler directly, or copy and run it in the search profiler:
Have you setup any agents to collect data at all? How was the data view for apm setup previously?
Hi Carly,
Thanks again for your reply, much appreciate.
When clicking on the Inspect button from the Vizualization, I do have this screen, but the Statistics tab is missing and there is no "Open in Search Profiler":
APM was not setup previously, therefore I believe I have to configure it. I'll try to find out how to setup agents and get back to you.
Best Regards,
Mihai Radulescu
Cool, do let us know how you get on with setting up your agents.
If you can't see the Search Profiler option in the Request tab you can use the Copy to clipboard option and access the Search Profiler under Dev Tools or using the search bar:
Hi Carly,
Thanks for the hint. I've done this and the query seems to have a reasonable time:
I believe that the issue might not be there, but in Kibana, in plotting the graphs. How can I conclude this for sure?
Best Regards,
Mihai Radulescu
If you think it might be slowness in Kibana over the query I would have a look at investigating via either APM or the Chrome Developer tools. They are covered in the same blog listed above.
Hi Carly,
I want to go with APM solution since it looks a more elegant one. I have followed this guide to install the node.js agent (since I've read here this is what is needed for debugging Kibana: Debugging Kibana | Kibana)
Here I can see that at least one agent is running, despite the fact that I didn't do the configuration part (I don't know where to add that config):
PS. I also had to do "apt install npm" (I'm on Ubuntu), but I have some doubts that the node.js agent is what I'm looking for, do I maybe need the Java one?
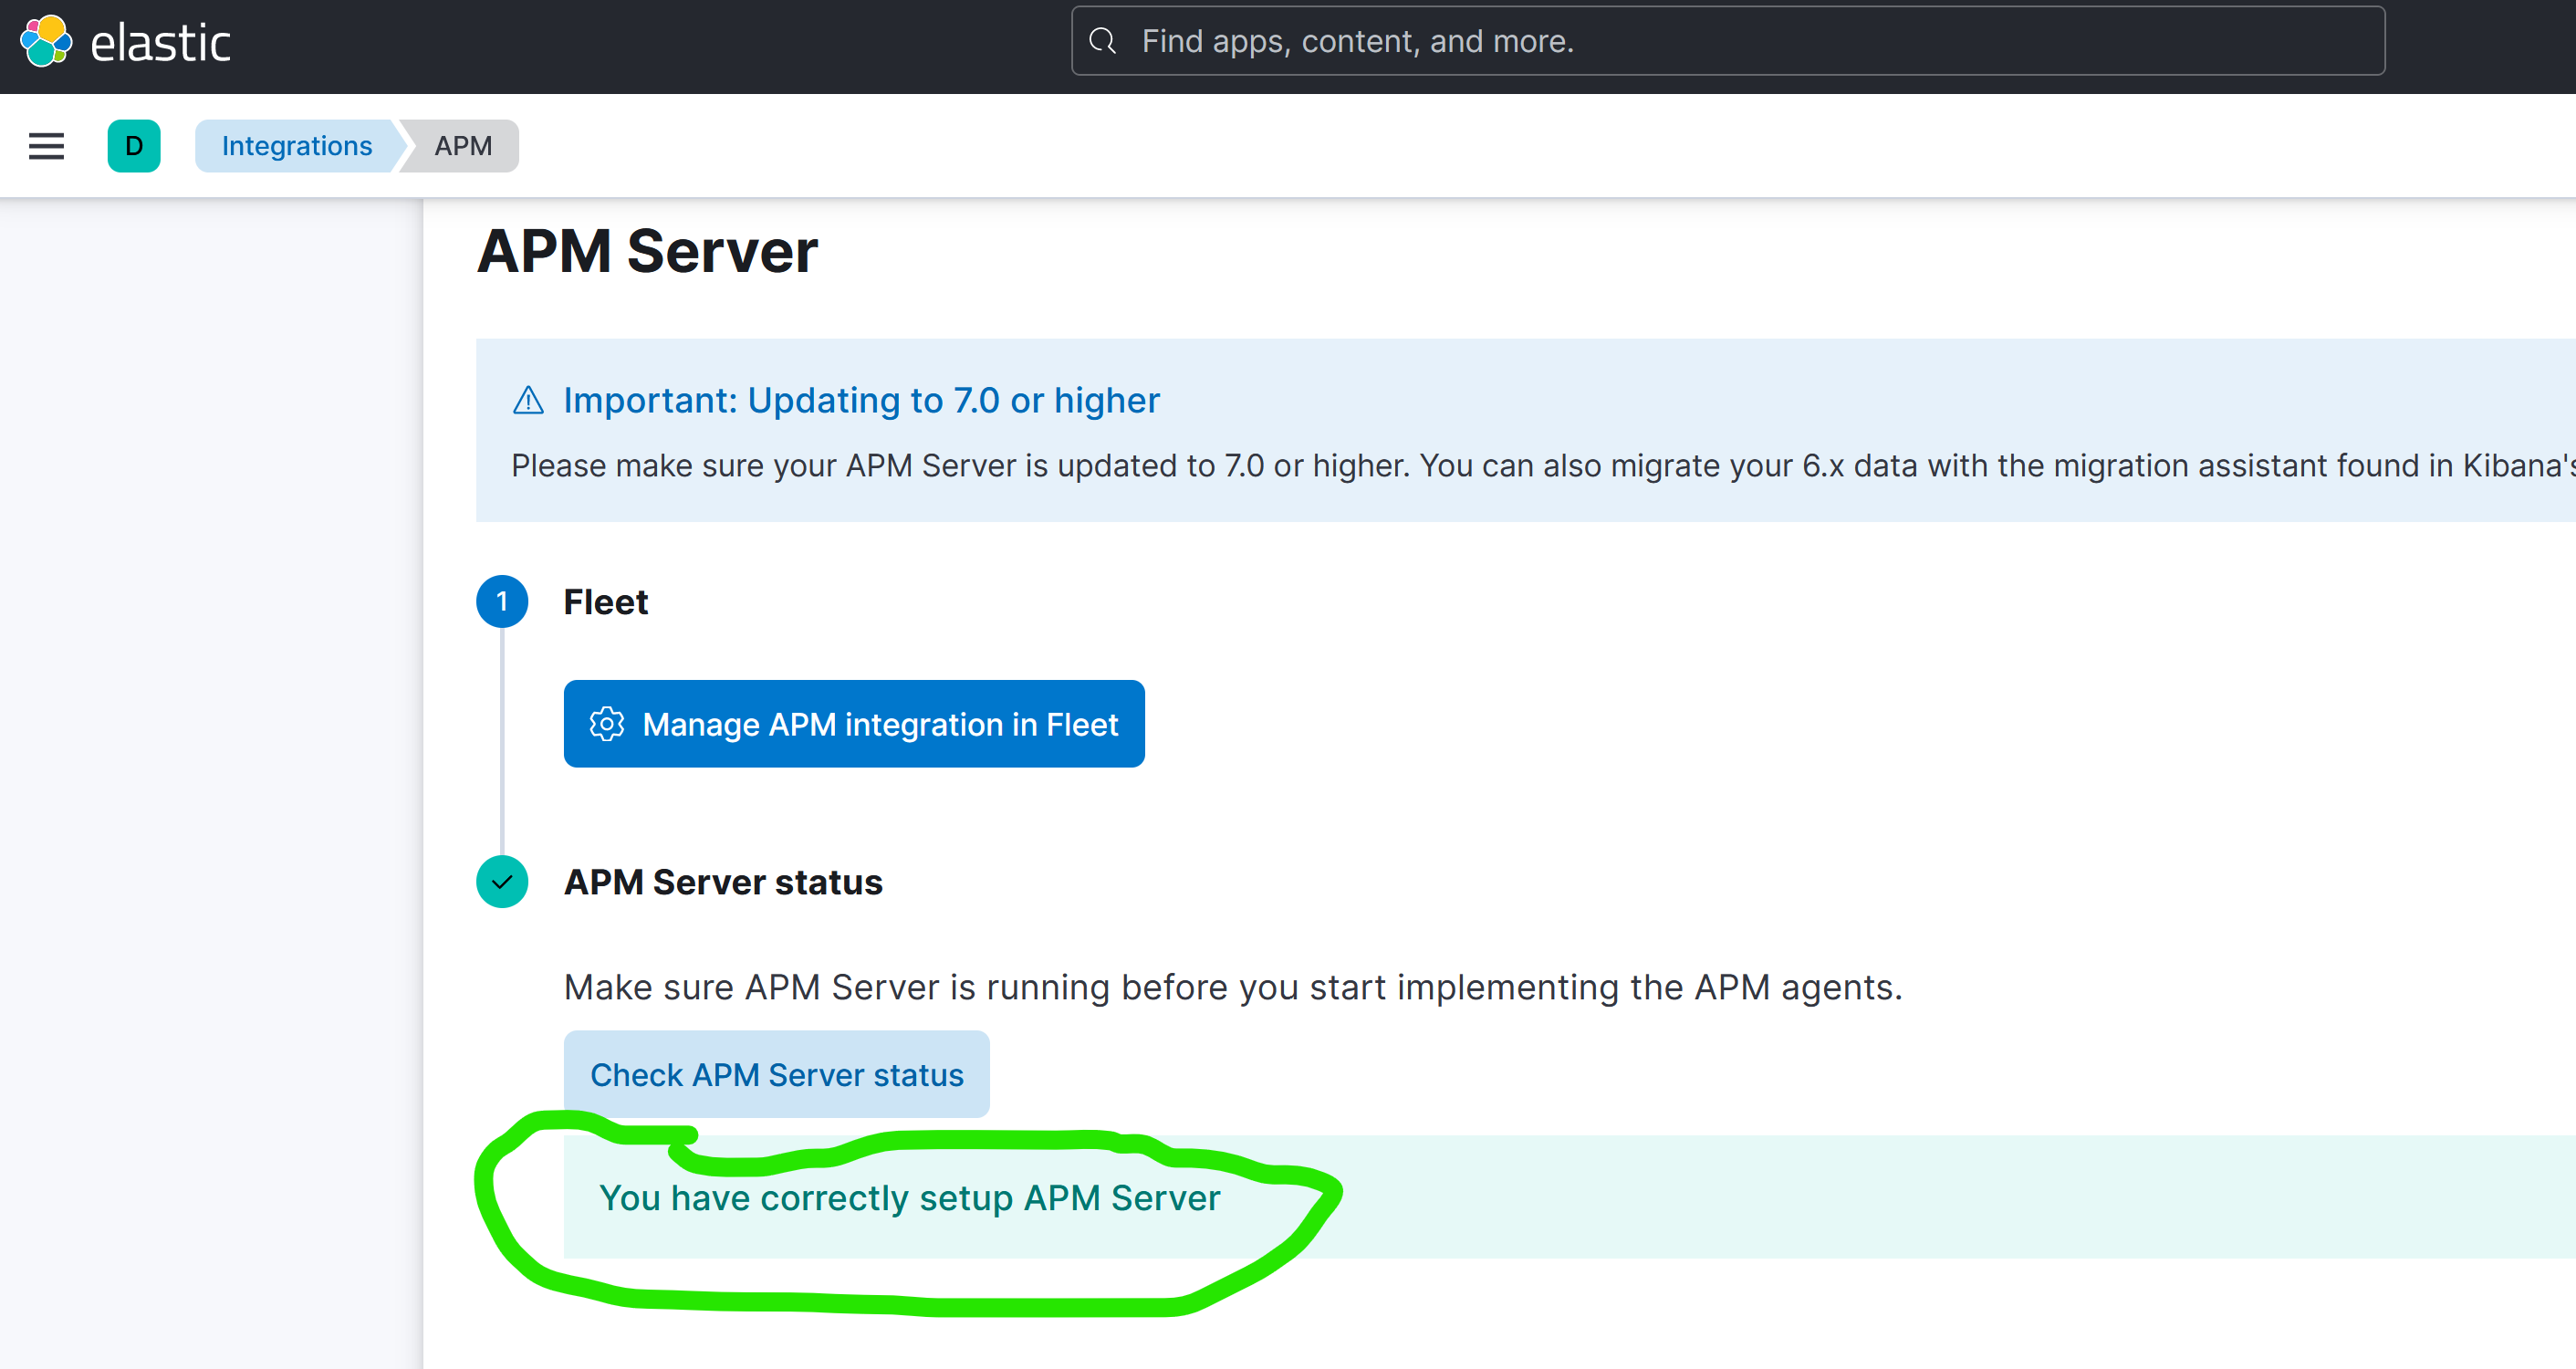
If I click on Launch APM at the bottom, it gets me back here (as if I don't have any active agent):
but APM is alive:
systemctl status apm-server.service
● apm-server.service - Elastic APM Server
Loaded: loaded (/lib/systemd/system/apm-server.service; disabled; vendor preset: enabled)
Active: active (running) since Wed 2023-06-07 11:45:41 UTC; 7min ago
Docs: Application performance monitoring (APM) with Elastic Observability | Elastic
Main PID: 1638999 (apm-server)
Tasks: 19 (limit: 75793)
Memory: 18.2M
CGroup: /system.slice/apm-server.service
└─1638999 /usr/share/apm-server/bin/apm-server --path.home /usr/share/apm-server --path.config /etc/apm-s>
Can you please advise further?
Best Regards,
Mihai Radulescu