I added Elasticsearch locally and to my Ubuntu server.
Now I downloaded Kibana and try to open it with 'bin/kibana'.
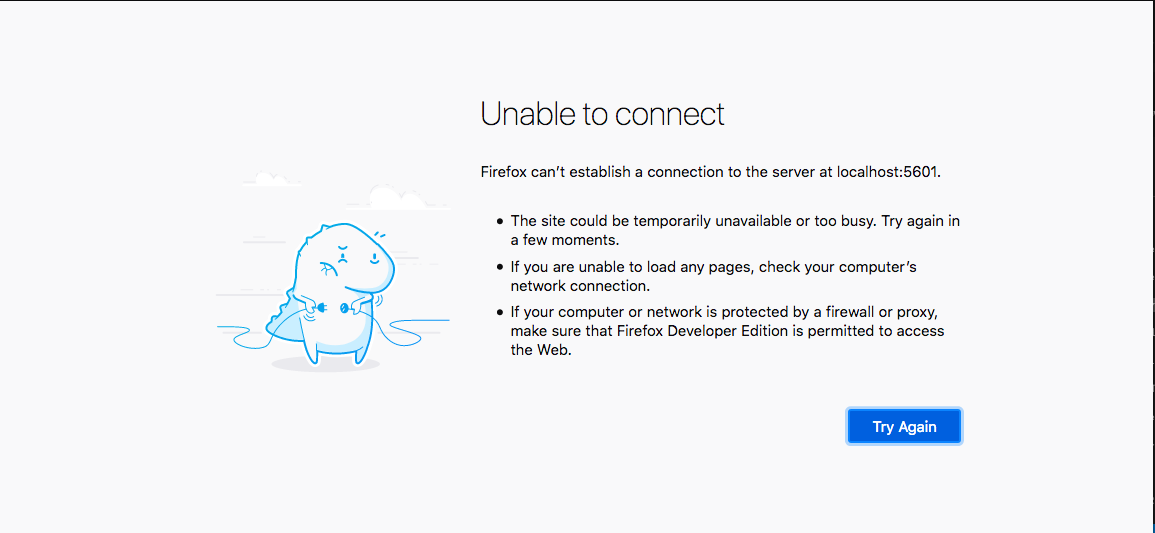
I try to visit http://localhost:5601/ and get a huge list that keeps growing until I press 'ctrl + c' (the long response in the bottom).
I also try to open my Rails server so it's open meanwhile, but changes nothing.
After that I try to add 'server.host: "localhost"' which changes nothing.
Then I change it to 'server.host: "0.0.0.0"' and still nothing.
Then I try it to 'server.host: "127.0.0.1"' and 'server.host: "193.69.47.103"' (which is my Ubuntu IP address) and still the same long response.
I want to run Kibana locally and after deploy it to Ubuntu.
Anyone knows what to do?
Thanks 
jonass-MacBook-Pro:kibana jonaspreisler$ bin/kibana
  log   [16:50:47.102] [info][plugins-system] Setting up [1] plugins: [translations]
  log   [16:50:47.112] [info][plugins][translations] Setting up plugin
  log   [16:50:47.114] [info][plugins-system] Starting [1] plugins: [translations]
  log   [16:51:24.462] [info][status][plugin:kibana@7.3.1] Status changed from uninitialized to green - Ready
  log   [16:51:24.478] [info][status][plugin:elasticsearch@7.3.1] Status changed from uninitialized to yellow - Waiting for Elasticsearch
  log   [16:51:24.481] [info][status][plugin:xpack_main@7.3.1] Status changed from uninitialized to yellow - Waiting for Elasticsearch
  log   [16:51:24.499] [info][status][plugin:telemetry@7.3.1] Status changed from uninitialized to green - Ready
  log   [16:51:24.501] [info][status][plugin:graph@7.3.1] Status changed from uninitialized to yellow - Waiting for Elasticsearch
  log   [16:51:24.518] [info][status][plugin:monitoring@7.3.1] Status changed from uninitialized to green - Ready
  log   [16:51:24.524] [info][status][plugin:spaces@7.3.1] Status changed from uninitialized to yellow - Waiting for Elasticsearch
  log   [16:51:24.538] [warning][security] Generating a random key for xpack.security.encryptionKey. To prevent sessions from being invalidated on restart, please set xpack.security.encryptionKey in kibana.yml
  log   [16:51:24.563] [warning][security] Session cookies will be transmitted over insecure connections. This is not recommended.
  log   [16:51:24.613] [info][status][plugin:security@7.3.1] Status changed from uninitialized to green - Ready
  log   [16:51:24.615] [info][status][plugin:searchprofiler@7.3.1] Status changed from uninitialized to yellow - Waiting for Elasticsearch
  log   [16:51:24.619] [info][status][plugin:ml@7.3.1] Status changed from uninitialized to yellow - Waiting for Elasticsearch
  log   [16:51:24.701] [info][status][plugin:tilemap@7.3.1] Status changed from uninitialized to yellow - Waiting for Elasticsearch
  log   [16:51:24.703] [info][status][plugin:watcher@7.3.1] Status changed from uninitialized to yellow - Waiting for Elasticsearch
  log   [16:51:24.725] [info][status][plugin:grokdebugger@7.3.1] Status changed from uninitialized to yellow - Waiting for Elasticsearch
  log   [16:51:24.733] [info][status][plugin:dashboard_mode@7.3.1] Status changed from uninitialized to green - Ready
  log   [16:51:24.735] [info][status][plugin:logstash@7.3.1] Status changed from uninitialized to yellow - Waiting for Elasticsearch
  log   [16:51:24.747] [info][status][plugin:beats_management@7.3.1] Status changed from uninitialized to yellow - Waiting for Elasticsearch
  log   [16:51:24.777] [info][status][plugin:apm_oss@7.3.1] Status changed from uninitialized to green - Ready
  log   [16:51:24.826] [info][status][plugin:apm@7.3.1] Status changed from uninitialized to green - Ready
  log   [16:51:24.830] [info][status][plugin:code@7.3.1] Status changed from uninitialized to green - Ready
  log   [16:51:24.832] [info][status][plugin:tile_map@7.3.1] Status changed from uninitialized to green - Ready
  log   [16:51:24.836] [info][status][plugin:task_manager@7.3.1] Status changed from uninitialized to green - Ready
  log   [16:51:24.844] [info][status][plugin:maps@7.3.1] Status changed from uninitialized to yellow - Waiting for Elasticsearch
  log   [16:51:24.857] [info][status][plugin:interpreter@7.3.1] Status changed from uninitialized to green - Ready
  log   [16:51:24.874] [info][status][plugin:canvas@7.3.1] Status changed from uninitialized to green - Ready
  log   [16:51:24.882] [info][status][plugin:license_management@7.3.1] Status changed from uninitialized to green - Ready
  log   [16:51:24.886] [info][status][plugin:cloud@7.3.1] Status changed from uninitialized to green - Ready
  log   [16:51:24.890] [info][status][plugin:index_management@7.3.1] Status changed from uninitialized to yellow - Waiting for Elasticsearch
  log   [16:51:24.917] [info][status][plugin:console@7.3.1] Status changed from uninitialized to green - Ready
  log   [16:51:24.920] [info][status][plugin:console_extensions@7.3.1] Status changed from uninitialized to green - Ready
  log   [16:51:24.926] [info][status][plugin:notifications@7.3.1] Status changed from uninitialized to green - Ready
  log   [16:51:24.957] [info][status][plugin:index_lifecycle_management@7.3.1] Status changed from uninitialized to yellow - Waiting for Elasticsearch
  log   [16:51:24.982] [info][status][plugin:metrics@7.3.1] Status changed from uninitialized to green - Ready
  log   [16:51:25.039] [info][status][plugin:infra@7.3.1] Status changed from uninitialized to green - Ready
  log   [16:51:25.042] [info][status][plugin:rollup@7.3.1] Status changed from uninitialized to yellow - Waiting for Elasticsearch
  log   [16:51:25.054] [info][siem] Plugin initializing
  log   [16:51:25.102] [info][siem] Plugin done initializing
  log   [16:51:25.103] [info][status][plugin:siem@7.3.1] Status changed from uninitialized to green - Ready