r_aravind
March 12, 2021, 12:47pm
1
I have setup my ELK stack kibana instance in Azure kubernetes. I have exposed my kibana service to external load balancer and accessing the load balancer service using DNS from NGINX ingress.
I have tried accessing elastic search endpoint using below cmd , it is giving me resopnsehttps://:9200$NAME-es-http/
After clearing browser cache (I tried in both chrome and edge latest version browser)
When i try to hit the DNS
Welcome to Elastic page is loading correctly without any console error.
Then after i tried logging in using the username -elastic and corresponding generated password.
it again downloading some 21.5 MB resource in console again showing the same login page to enter credential.
Please help me to solve this
rashmi
March 12, 2021, 3:46pm
2
What version of Chrome and what version of the stack you are using?
r_aravind
March 12, 2021, 5:29pm
3
My chrome version is Version 89.0.4389.82 (Official Build) (64-bit)
I also tried in incognito window same problem.
I checked kibana pod log also no errors.
As suggested in another discussion i have used
under my config section of my kibana yaml
That gives me internal server down so i removed it.
rashmi
March 12, 2021, 5:34pm
4
What do the kibana logs say ?
r_aravind
March 13, 2021, 5:05pm
5
Kibana pod log is continuously generating not able track the logs.
Is anyother place i need to check the log for kubernetes pod ??
r_aravind
March 15, 2021, 9:41am
6
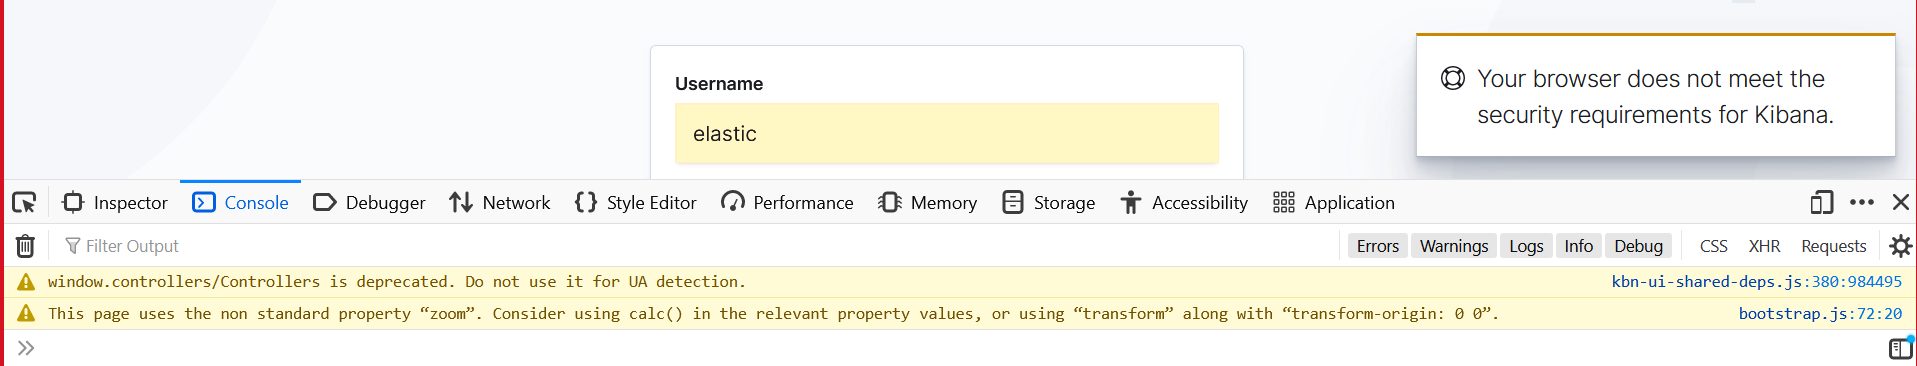
only error we are getting is in UI "Your browser does not meet the security requirements for Kibana."
And we also tried in firefox same issue,
In console alone we are getting below warning
r_aravind
March 15, 2021, 10:52am
7
Below message we got in kibana pod looks suspicious.
{"type":"response","@timestamp ":"2021-03-13T07:46:03Z","tags":xxx-dev-xxx.xxxxx.com ","x-real-ip":"xx.x.x.xx","x-forwarded-for":"xx.0.5.xx","x-forwarded-host":"xxxx-dev-xx.xxx.com ","x-forwarded-port":"443","x-forwarded-proto":"https","connection":"close","content-length":"190","sec-ch-ua":""Google Chrome";v="89", "Chromium";v="89", ";Not A Brand";v="99"","sec-ch-ua-mobile":"?0","user-agent":"Mozilla/5.0 (Windows NT 10.0; Win64; x64) AppleWebKit/537.36 (KHTML, like Gecko) Chrome/89.0.4389.82 Safari/537.36 managedpc (xxxxxxx)","kbn-version":"7.10.1","content-type":"application/json","accept":"/ ","origin":"https://xxxxx-dev-xx.xxxx.com ","sec-fetch-site":"same-origin","sec-fetch-mode":"cors","sec-fetch-dest":"empty","referer":"https://xxxx-dev-xx.xxxx.com/login?next=%2F","accept-encoding":"gzip , deflate, br","accept-language":"en-US,en;q=0.9"},"remoteAddress":"xx.0.5.xx","userAgent":"Mozilla/5.0 (Windows NT 10.0; Win64; x64) AppleWebKit/537.36 (KHTML, like Gecko) Chrome/89.0.4389.82 Safari/537.36 managedpc (xxxxxxx)","referer":"https://xx-dev-xx.xxxx.com/login?next=%2F"},"res":{"statusCode":401,"responseTime":24,"contentLength":9},"message":"POST /internal/security/login 401 24ms - 9.0B"}
rashmi
March 15, 2021, 3:01pm
8
Kibana shows this message if a browser doesn't support content-security-policy . Which shouldn't be a problem for all the modern browsers except IE11.
Do you have a proxy in front of Kibana that could affect set CSP headers?Provide a doc link to IE 11 users when showing "Your browser does not meet the security requirements.." · Issue #38781 · elastic/kibana · GitHub
Thanks
r_aravind
March 17, 2021, 6:10pm
9
yes we have defined below set of proxy rules,
annotations:kubernetes.io/ingress.class: nginxnginx.org/client-max-body-size: 4mnginx.org/proxy-connect-timeout: 30snginx.org/proxy-read-timeout: 20snginx.ingress.kubernetes.io/backend-protocol: "HTTPS"nginx.org/redirect-to-https: "True"ingress.kubernetes.io/ssl-redirect: "True"nginx.org/server-snippets: |.XXX.com https:// .elastic.co https://grafana.com 'unsafe-inline' blob:; worker-src https://*.XXX.com 'unsafe-inline' blob:; img-src 'self' data:; style-src 'self' 'unsafe-inline'; script-src 'self' 'unsafe-inline' 'unsafe-eval' ; font-src 'self' data:; block-all-mixed-content; upgrade-insecure-requests" always;
nginx.org/location-snippets: |
  proxy_hide_header Cache-Control;
  proxy_hide_header Content-Security-Policy;
pls let me know if above headers are blocking anything
rashmi
May 3, 2021, 5:06pm
11
@LeeDr / @jbudz - any idea why this would be ?
jbudz
May 3, 2021, 7:53pm
12
I would advise removing the CSP headers at the proxy level as a starting point. The error occurs during a CSP validation phase from Kibana. Kibana willl attach it's own requirements if they're forwarded.
Is there a requirement to have these enforced by the proxy?