Thanks. One more for you to run, this time against Kibana using curl:
curl http://localhost:5601/api/status.
Also, Do you have the logs from when Kibana first starts up? Those would be very helpful too
Thanks. One more for you to run, this time against Kibana using curl:
curl http://localhost:5601/api/status.
Also, Do you have the logs from when Kibana first starts up? Those would be very helpful too
# curl http://localhost:5601/api/status
curl: (7) Failed connect to localhost:5601; Connection refused
Do you have these startup logs?
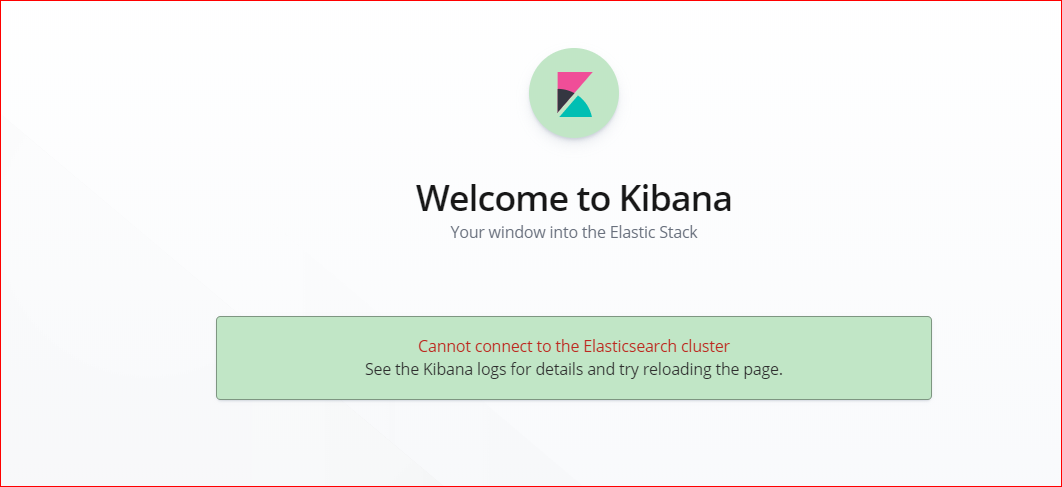
I have removed elasticsearch one by one removing the all old configs and Kibana version to all 3 nodes to 6.7.0 but still kibana not loading ..

kibana logs..


["status","plugin:tilemap@6.6.2","error"],"pid":37023,"state":"red","message":"Status changed from red to red - Service Unavailable","prevState":"red","prevMsg":"[data] Elasticsearch cluster did not respond with license information."}
["status","plugin:tilemap@6.6.2","error"],"pid":37023,"state":"red","message":"Status changed from red to red - Unable to connect to Elasticsearch.","prevState":"red","prevMsg":"[data] Elasticsearch cluster did not respond with license information."}
["status","plugin:watcher@6.6.2","error"],"pid":37023,"state":"red","message":"Status changed from red to red - [data] Elasticsearch cluster did not respond with license information.","prevState":"red","prevMsg":"No Living connections"}
["status","plugin:watcher@6.6.2","error"],"pid":37023,"state":"red","message":"Status changed from red to red - [data] Elasticsearch cluster did not respond with license information.","prevState":"red","prevMsg":"Service Unavailable"}
["status","plugin:watcher@6.6.2","error"],"pid":37023,"state":"red","message":"Status changed from red to red - No Living connections","prevState":"red","prevMsg":"Unable to connect to Elasticsearch."}
["status","plugin:watcher@6.6.2","error"],"pid":37023,"state":"red","message":"Status changed from red to red - Service Unavailable","prevState":"red","prevMsg":"[data] Elasticsearch cluster did not respond with license information."}
["status","plugin:watcher@6.6.2","error"],"pid":37023,"state":"red","message":"Status changed from red to red - Unable to connect to Elasticsearch.","prevState":"red","prevMsg":"[data] Elasticsearch cluster did not respond with license information."}
["status","plugin:xpack_main@6.6.2","error"],"pid":37023,"state":"red","message":"Status changed from red to red - [data] Elasticsearch cluster did not respond with license information.","prevState":"red","prevMsg":"No Living connections"}
["status","plugin:xpack_main@6.6.2","error"],"pid":37023,"state":"red","message":"Status changed from red to red - [data] Elasticsearch cluster did not respond with license information.","prevState":"red","prevMsg":"Service Unavailable"}
["status","plugin:xpack_main@6.6.2","error"],"pid":37023,"state":"red","message":"Status changed from red to red - No Living connections","prevState":"red","prevMsg":"Unable to connect to Elasticsearch."}
["status","plugin:xpack_main@6.6.2","error"],"pid":37023,"state":"red","message":"Status changed from red to red - Service Unavailable","prevState":"red","prevMsg":"[data] Elasticsearch cluster did not respond with license information."}
["status","plugin:xpack_main@6.6.2","error"],"pid":37023,"state":"red","message":"Status changed from red to red - Unable to connect to Elasticsearch.","prevState":"red","prevMsg":"[data] Elasticsearch cluster did not respond with license information."}
["warning","elasticsearch","admin"],"pid":37023,"message":"No living connections"}
["warning","elasticsearch","admin"],"pid":37023,"message":"Unable to revive connection: http://localhost:9200/"}
["warning","elasticsearch","data"],"pid":37023,"message":"No living connections"}
["warning","elasticsearch","data"],"pid":37023,"message":"Unable to revive connection: http://localhost:9200/"}["status","plugin:rollup@6.6.2","error"],"pid":37023,"state":"red","message":"Status changed from red to red - Service Unavailable","prevState":"red","prevMsg":"[data] Elasticsearch cluster did not respond with license information."}
["status","plugin:rollup@6.6.2","error"],"pid":37023,"state":"red","message":"Status changed from red to red - Unable to connect to Elasticsearch.","prevState":"red","prevMsg":"[data] Elasticsearch cluster did not respond with license information."}
["status","plugin:searchprofiler@6.6.2","error"],"pid":37023,"state":"red","message":"Status changed from red to red - [data] Elasticsearch cluster did not respond with license information.","prevState":"red","prevMsg":"No Living connections"}
["status","plugin:searchprofiler@6.6.2","error"],"pid":37023,"state":"red","message":"Status changed from red to red - [data] Elasticsearch cluster did not respond with license information.","prevState":"red","prevMsg":"Service Unavailable"}
["status","plugin:searchprofiler@6.6.2","error"],"pid":37023,"state":"red","message":"Status changed from red to red - No Living connections","prevState":"red","prevMsg":"Unable to connect to Elasticsearch."}
["status","plugin:searchprofiler@6.6.2","error"],"pid":37023,"state":"red","message":"Status changed from red to red - Service Unavailable","prevState":"red","prevMsg":"[data] Elasticsearch cluster did not respond with license information."}
["status","plugin:searchprofiler@6.6.2","error"],"pid":37023,"state":"red","message":"Status changed from red to red - Unable to connect to Elasticsearch.","prevState":"red","prevMsg":"[data] Elasticsearch cluster did not respond with license information."}
["status","plugin:spaces@6.6.2","error"],"pid":37023,"state":"red","message":"Status changed from red to red - [data] Elasticsearch cluster did not respond with license information.","prevState":"red","prevMsg":"No Living connections"}
["status","plugin:spaces@6.6.2","error"],"pid":37023,"state":"red","message":"Status changed from red to red - [data] Elasticsearch cluster did not respond with license information.","prevState":"red","prevMsg":"Service Unavailable"}
["status","plugin:spaces@6.6.2","error"],"pid":37023,"state":"red","message":"Status changed from red to red - No Living connections","prevState":"red","prevMsg":"Unable to connect to Elasticsearch."}
["status","plugin:spaces@6.6.2","error"],"pid":37023,"state":"red","message":"Status changed from red to red - Service Unavailable","prevState":"red","prevMsg":"[data] Elasticsearch cluster did not respond with license information."}
["status","plugin:spaces@6.6.2","error"],"pid":37023,"state":"red","message":"Status changed from red to red - Unable to connect to Elasticsearch.","prevState":"red","prevMsg":"[data] Elasticsearch cluster did not respond with license information."}
["status","plugin:tilemap@6.6.2","error"],"pid":37023,"state":"red","message":"Status changed from red to red - [data] Elasticsearch cluster did not respond with license information.","prevState":"red","prevMsg":"No Living connections"}
["status","plugin:tilemap@6.6.2","error"],"pid":37023,"state":"red","message":"Status changed from red to red - [data] Elasticsearch cluster did not respond with license information.","prevState":"red","prevMsg":"Service Unavailable"}
["status","plugin:tilemap@6.6.2","error"],"pid":37023,"state":"red","message":"Status changed from red to red - No Living connections","prevState":"red","prevMsg":"Unable to connect to Elasticsearch."}["debug","legacy-proxy"],"pid":37023,"message":"Event is being forwarded: connection"}
["debug","legacy-proxy"],"pid":37023,"message":"\"getConnections\" has been called."}
["debug","legacy-service"],"pid":37023,"message":"Request will be handled by proxy GET:/."}
["debug","legacy-service"],"pid":37023,"message":"Request will be handled by proxy GET:/app/kibana."}
["debug","monitoring-ui","kibana-monitoring"],"pid":37023,"message":"Received Kibana Ops event data"}
["debug","root"],"pid":37023,"message":"shutting root down"}
["error","elasticsearch","admin"],"pid":37023,"message":"Request error, retrying\nHEAD http://localhost:9200/ => connect ECONNREFUSED 127.0.0.1:9200"}
["error","elasticsearch","data"],"pid":37023,"message":"Request error, retrying\nGET http://localhost:9200/_xpack => connect ECONNREFUSED 127.0.0.1:9200"}
["license","debug","xpack"],"pid":37023,"message":"Calling [data] Elasticsearch _xpack API. Polling frequency: 30001"}
["license","warning","xpack"],"pid":37023,"message":"License information from the X-Pack plugin could not be obtained from Elasticsearch for the [data] cluster. Error: No Living connections"}
[],"pid":37023,"method":"get","statusCode":302,"req":{"url":"/app/kibana","method":"get","headers":{"host":"elkhost01.trident.com:5601","user-agent":"Mozilla/5.0 (Windows NT 10.0; Win64; x64) AppleWebKit/537.36 (KHTML, like Gecko) Chrome/73.0.3683.103 Safari/537.36","accept":"text/html,application/xhtml+xml,application/xml;q=0.9,image/webp,image/apng,*/*;q=0.8,application/signed-exchange;v=b3","accept-encoding":"gzip, deflate","accept-language":"en-US,en;q=0.9,ko;q=0.8","cache-control":"max-age=0","dnt":"1","upgrade-insecure-requests":"1"},"remoteAddress":"192.168.1.106","userAgent":"192.168.1.106"},"res":{"statusCode":302,"responseTime":2,"contentLength":9},"message":"GET /app/kibana 302 2ms - 9.0B"}
[],"pid":37023,"method":"get","statusCode":302,"req":{"url":"/app/kibana","method":"get","headers":{"host":"elkhost01.trident.com:5601","user-agent":"Mozilla/5.0 (Windows NT 10.0; Win64; x64) AppleWebKit/537.36 (KHTML, like Gecko) Chrome/73.0.3683.103 Safari/537.36","accept":"text/html,application/xhtml+xml,application/xml;q=0.9,image/webp,image/apng,*/*;q=0.8,application/signed-exchange;v=b3","accept-encoding":"gzip, deflate","accept-language":"en-US,en;q=0.9,ko;q=0.8","cache-control":"max-age=0","dnt":"1","upgrade-insecure-requests":"1"},"remoteAddress":"192.168.1.106","userAgent":"192.168.1.106"},"res":{"statusCode":302,"responseTime":3,"contentLength":9},"message":"GET /app/kibana 302 3ms - 9.0B"}
[],"pid":37023,"method":"get","statusCode":302,"req":{"url":"/app/kibana","method":"get","headers":{"host":"elkhost01.trident.com:5601","user-agent":"Mozilla/5.0 (Windows NT 10.0; Win64; x64) AppleWebKit/537.36 (KHTML, like Gecko) Chrome/73.0.3683.103 Safari/537.36","accept":"text/html,application/xhtml+xml,application/xml;q=0.9,image/webp,image/apng,*/*;q=0.8,application/signed-exchange;v=b3","accept-encoding":"gzip, deflate","accept-language":"en-US,en;q=0.9,ko;q=0.8","cache-control":"max-age=0","dnt":"1","upgrade-insecure-requests":"1"},"remoteAddress":"192.168.1.106","userAgent":"192.168.1.106"},"res":{"statusCode":302,"responseTime":4,"contentLength":9},"message":"GET /app/kibana 302 4ms - 9.0B"}These messages tell me that Elasticsearch is not listening on 127.0.0.1 / port 9200. Is Elasticsearch running, and is it running on the same machine as Kibana? Is Elasticsearch configured for https instead of http, or is it running on a custom port?
Can you provide your kibana.yml and elasticsearch.yml?
Please find the config file below..
# cat /etc/elasticsearch/elasticsearch.yml
# Elasticserach config
#########################
cluster.name: log-cohort
node.name: elkserver01
#node.master: true
path:
    data: /data/lib/elasticsearch
    logs: /var/log/elasticsearch
network.host: 0.0.0.0
http.port: 9200
discovery.zen.ping.unicast.hosts: ["elkserver01", "elkserver02", "elkserver03"]
xpack.security.enabled: False
#bootstrap.memory_lock: False


# cat /etc/kibana/kibana.yml
server.port: 5601
server.host: 0.0.0.0
server.name: elkserver01.cadence.com
elasticsearch.hosts: ["http://localhost:9200"]
Just to acknowledge , i have to rebuild the ELK stack again.
This topic was automatically closed 28 days after the last reply. New replies are no longer allowed.
© 2020. All Rights Reserved - Elasticsearch
Apache, Apache Lucene, Apache Hadoop, Hadoop, HDFS and the yellow elephant logo are trademarks of the Apache Software Foundation in the United States and/or other countries.