Kibana only displaying certain ip address from csv file

I am posting a csv file directly to elasticsearch and Kibana only displays certain ip addresses. Below might explain better.

csv file:

id,IP,Hostname,OS,Scan Start,Scan End,CVSS,Severity,High,Medium,Low,Log,False Positive,Total
1,'10.100.1.4',google,cpe:/o:cisco,2017-06-16T18:50:26Z,2017-06-16T19:15:35Z,10.0,High,10,5,1,17,0,24
2,'10.100.1.23',google,cpe:/o:linux:kernel,2017-06-16T19:00:59Z,2017-06-16T19:25:34Z,6.8,Medium,0,7,2,38,0,47
3,'10.100.1.24',google,cpe:/o:linux:kernel,2017-06-16T19:05:01Z,2017-06-16T19:30:11Z,6.8,Medium,0,7,2,38,0,47

Out of these three id's, Kibana only displays the IP addresses in which the last octet starts with 2. 10.100.1.23 and 10.100.1.24 are displayed but not 10.100.1.4. Additionally 10.100.1.200, 10.100.1.201 are shown but not 10.100.1.41. This is why I believe it is the last octet of the IP address but have zero idea as to why this might be occurring.

Thanks in advance..
Hi @bm1391,

I require some additional information about your setup in order to provide assistance. Which version of the Elastic Stack are you using? When you say "posting a csv file directly to elasticsearch", what does that mean? What do the documents in Elasticsearch look like?

Sure, Here is the additional information:

Elasticsearch version number: 2.4.6
Kibana Version: 4.5.4

I have posted the csv file to Elasticsearch with curl command in python. Here is the python command:
This just reads my csv file(ready.csv) and puts the values into Elasticsearch.

python csv_to_elastic.py
--csv-file ready.csv
--elastic-path "$HOSTNAME/file/%id%"
--json-struct '{
"IP" : "%IP%",
"Hostname" : "%Hostname%",
"OS" : "%OS%",
"Scan Start" : "%Scan Start%",
"Scan End" : "%Scan End%",
"CVSS" : "%CVSS%",
"Severity" : "%Severity%",
"High" : "%High%",
"Medium" : "%Medium%",
"Low" : "%Low%",
"Log" : "%Log%",
"False Positive" : "%False Positive%",
"Total" : "%Total%"
}'

This is what I see when I query for the indices in Elasticsearch: You see 254 for 254 ip addresses from the CSV file:

yellow open globex-network 5 1 254 0 243.8kb 243.8kb

CSV file: (There are 254 lines)

id,IP,Hostname,OS,Scan Start,Scan End,CVSS,Severity,High,Medium,Low,Log,False Positive,Total
1,192.168.1.13,,cpe:/o:canonical:ubuntu_linux:16.04,2017-08-26T19:29:29Z,2017-08-26T19:46:43Z,2.6,Low,0,0,1,7,0,8
2,192.168.1.1,,cpe:/o:linux:kernel,2017-08-26T19:29:28Z,2017-08-26T19:53:05Z,0.0,None,0,0,0,2,0,2

This is what I see in Kibana on the Discover page:

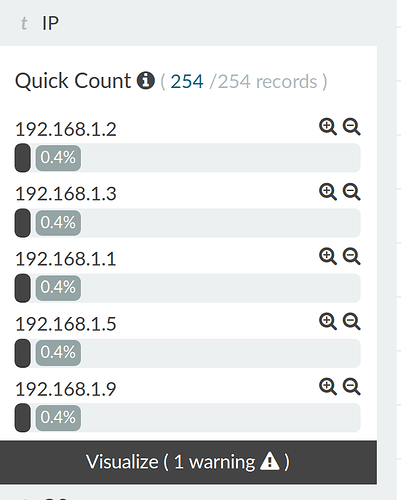
But when I go to visualize the data, I can only see a certain amount of them:

The "size" setting on your x-axis "Terms" aggregation influences the number of terms that are displayed. It defaults to 5, but you can increase it in the aggregation settings on the left side of the visualization editor.

This topic was automatically closed 28 days after the last reply. New replies are no longer allowed.