Im doing something wrong, i want a pie chart to show for all the docs in the index the number of unique docs (based on a string) and non-unique(based on the same string)
So if i had
doc1
field: test

doc2
field: test

doc3
field: hello
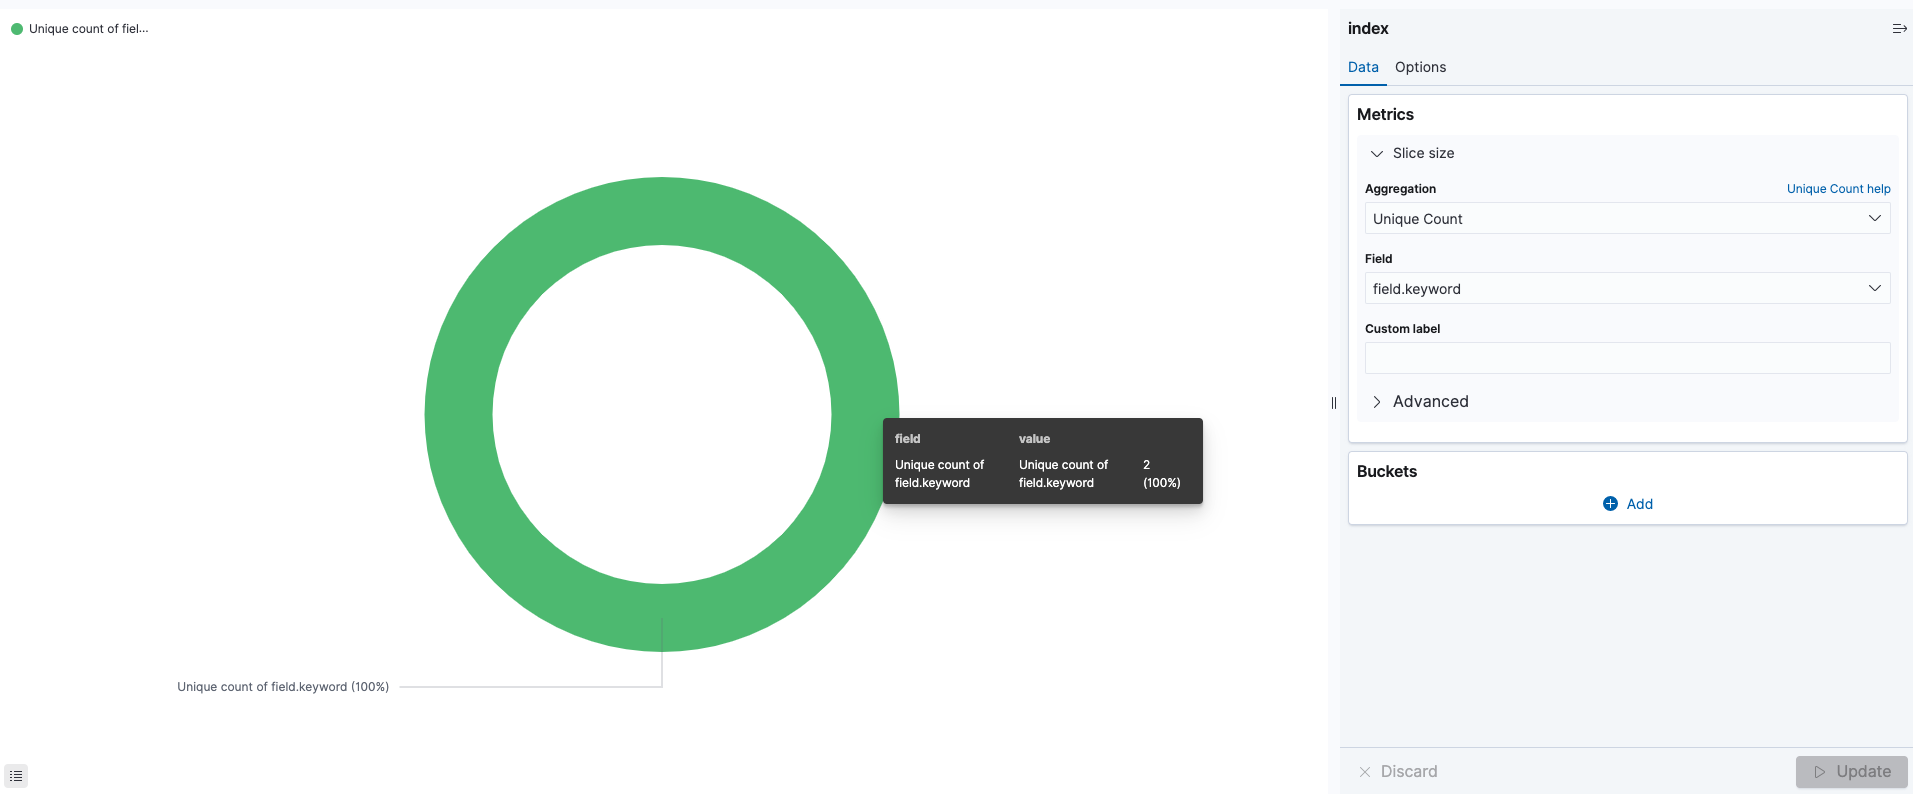
Pie chart should show Unique 66% and non-unique 33% as a pie chart. I just get 100% when i used unique count on that field?
There is no date filter on this index, the docs in the index have no date attached to them so the date filter in the pie chart is off, it showing 2 as 100% is the issue im trying to solve?
Apache, Apache Lucene, Apache Hadoop, Hadoop, HDFS and the yellow elephant
logo are trademarks of the
Apache Software Foundation
in the United States and/or other countries.