Hi,
I am trying to show a success rate of builds in percentage mode using Count of Y-axis as an aggregation.
When I set my:
- Metrics mode in normal and Y-axes in normal, it shows the data as expected(picture 1).
- Metrics mode in stacked and Y-axes in normal, it shows the data in stacked normal as expected (picture2)
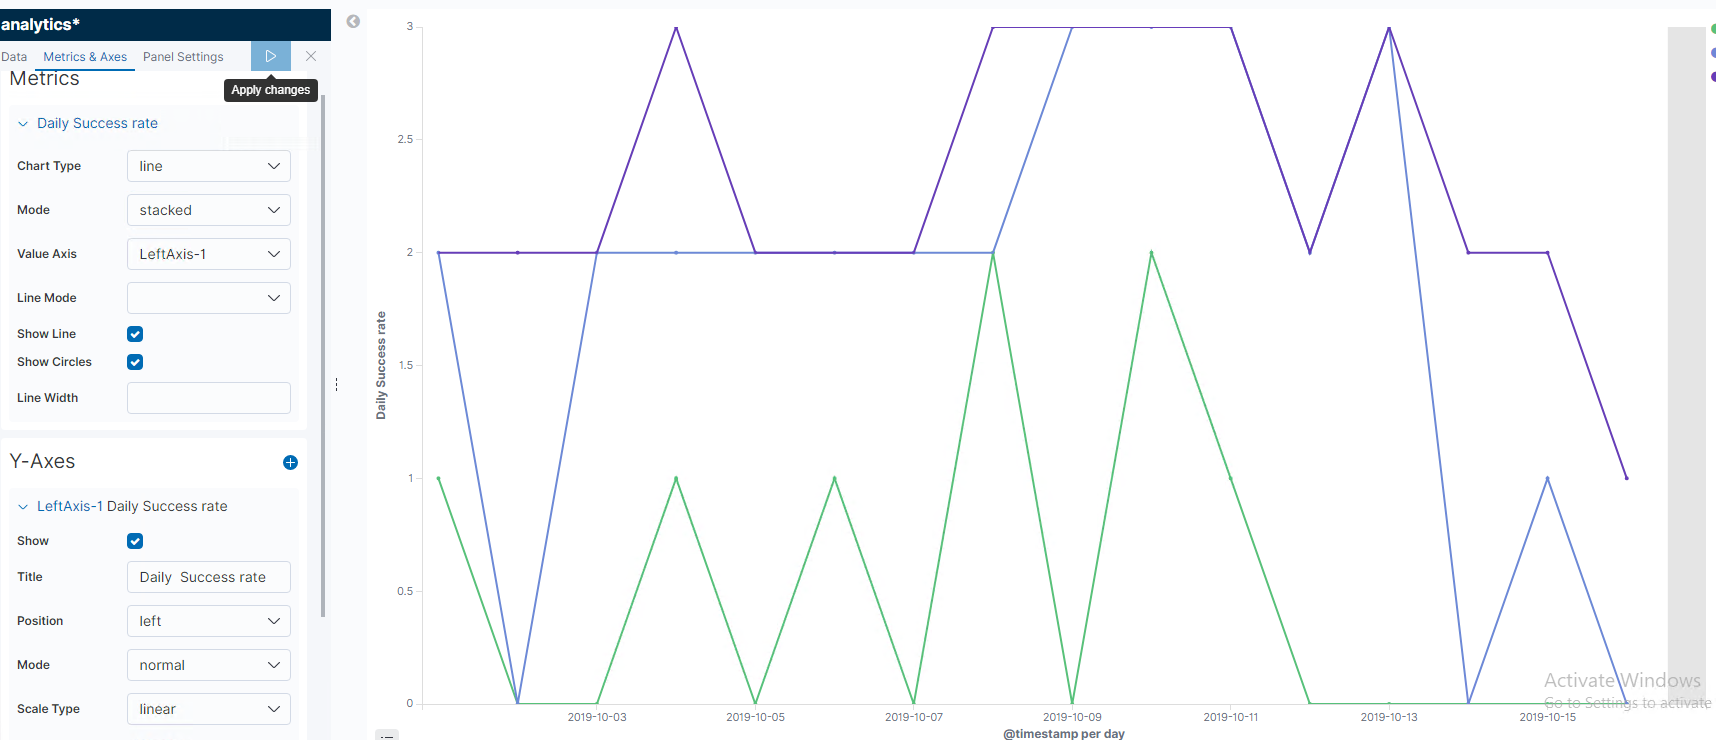
The issue is with percentage mode when both stacked and normal metrics mode show stacked data as shown in picture 3 and I need to show it in normal mode where data per each day are gonna add up to 100%
Is this a bug by kibana or do i need to adjust the data to fit the percentage mode? If so, what would be the possible solution? I am using build counts with field being either SUCCESS or FAILURE, i need success rate for given day
Are you trying to show all 3 on the same chart? If so, I suggest using a bar chart, without the Stacked option, in percentage mode. This way they are way more visible.
Hi, I am indeed trying to show all three lines/fields in the graph. I have tried the bar chart and it is showing the the desired normal mode correctly. My team, however, is very dependent on the chart being a line chart. Do you know why my percentage mode is not showing in normal?
The percentage mode for the X-axis considers the values to be between 0 and 1 and converts them to percentages.
The percentage mode for the Y-axis takes the values of all 3 of them as a total and displays how much of the total each one is.
So this is why the bar chart is how you should display it on a single chart.
If they want it to be a line, you could do a split chart on the field that you did split series, and then use percentage mode. That way you would have 3 charts in one.