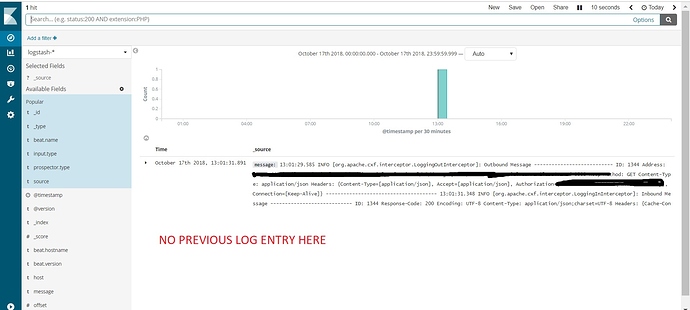
I have setup ELK.
Looks like it is working fine as it is shipping logs from all four files which I am reading from using filebeat.
However in Kibana, it only shows last entry.
The previous entry gets replaced from the view when new one comes in.
e.g If there is an entry showing up at 10:00 PM, it gets replaced by next entry at 10:01 PM.
At top left corner of Kibana, I always see "1 Hit".
How can I get my history logs?
************************************************************************LOGSTASH.CONF FILE
************************************************************************input
{
beats
{
port => 5045
ssl => true
ssl_certificate => "/opt/bitnami/logstash/ssl/logstash-remote.crt"
ssl_key => "/opt/bitnami/logstash/ssl/logstash-remote.key"
}
gelf
{
host => "0.0.0.0"
port => 12201
}
http
{
ssl => false
host => "0.0.0.0"
port => 8888
}
tcp
{
mode => "server"
host => "0.0.0.0"
port => 5010
}
udp
{
host => "0.0.0.0"
port => 5000
}
}
filter
{
grok {
match => { "message" => "COMBINEDAPACHELOG %{COMMONAPACHELOG} %{QS:referrer} %{QS:agent}" }
}
date {
match => [ "timestamp" , "dd/MMM/yyyy:HH:mm:ss Z" ]
}
}
output
{
elasticsearch
{
    hosts => ["127.0.0.1:9200"]
    document_id => "%{logstash_checksum}"
    index => "logstash-%{+YYYY.MM.dd}"
}
}
************************************************************************FILEBEAT.YML
************************************************************************filebeat.inputs:
- type: log
enabled: true
paths:
- /opt/apache-tomcat-8.5.32/logs/jaxws-cxf-ws.log
multiline.pattern: '^[0-9]{2}:[0-9]{2}:[0-9]{2}.[0-9]{3}'
multiline.negate: true
multiline.match: after
   - type: log
     enabled: true
     paths:
       - /opt/apache-tomcat-8.5.32/logs/ipb-app.log
     multiline.pattern: '^\[0-9]{2}:[0-9]{2}:[0-9]{2}.[0-9]{3}'
     multiline.negate: true
     multiline.match: after
     fields:
     ipb-app-log: true
     fields_under_root: true

   - type: log
     enabled: true
     paths:
       - /opt/apache-tomcat-8.5.32/logs/ipb-app-security.log
     multiline.pattern: '^\[0-9]{2}:[0-9]{2}:[0-9]{2}.[0-9]{3}'
     multiline.negate: true
     multiline.match: after
     fields:
     app_id: Sudarshan-Sec
     fields_under_root: true

   - type: log
     enabled: true
     paths:
       - /opt/apache-tomcat-8.5.32/logs/catalina.out
     multiline.pattern: '^\[0-9]{2}:[0-9]{2}:[0-9]{2}.[0-9]{3}'
     multiline.negate: true
     multiline.match: after
     fields:
     app_id: Sudarshan-Catalina
     fields_under_root: true
output.logstash:
hosts: ["10.4.0.138:5045"]
bulk_max_size: 1024
ssl.certificate_authorities: ["/etc/pki/tls/certs/logstash-remote.crt"]
I haven't changed anything on elasticsearch.yml, logstash.yml and kibana.yml
Two attached files show my Kibana dashboard captured within minutes.


