Hi, I'm trying to build a Kibana dashboard to display top hit URLs in a time period. I'm using ElasticSearch V7.6 and Kibana V7.6. The documents pattern I have is like this:
{
  "_index": "user_action",
  "_type": "_doc",
  "_id": "6f6Vp3ABp0lZaDtyHbk4",
  "_version": 1,
  "_score": 1,
  "_source": {
    "username": "cat",
    "role": "admin",
    "action": "kibanaView",
    "value": "query=foo",
    "@timestamp": "2020-03-04T14:05:31-08:00",
    "time": "2020-03-04T14:05:31-08:00"
  },
  "fields": {
    "@timestamp": [
      "2020-03-04T22:05:31.000Z"
    ],
    "time": [
      "2020-03-04T22:05:31.000Z"
    ]
  }
}
As you can see, I added the @timestamp and time fields to this JSON pattern.
I added two documents with above JSON pattern to ElasticSearch, and do Index Patterns refresh via Kibana management page to make sure both of the date type fields are existing in Index Patterns page:

Then I go to Dashboard page to create a dashboard like this:
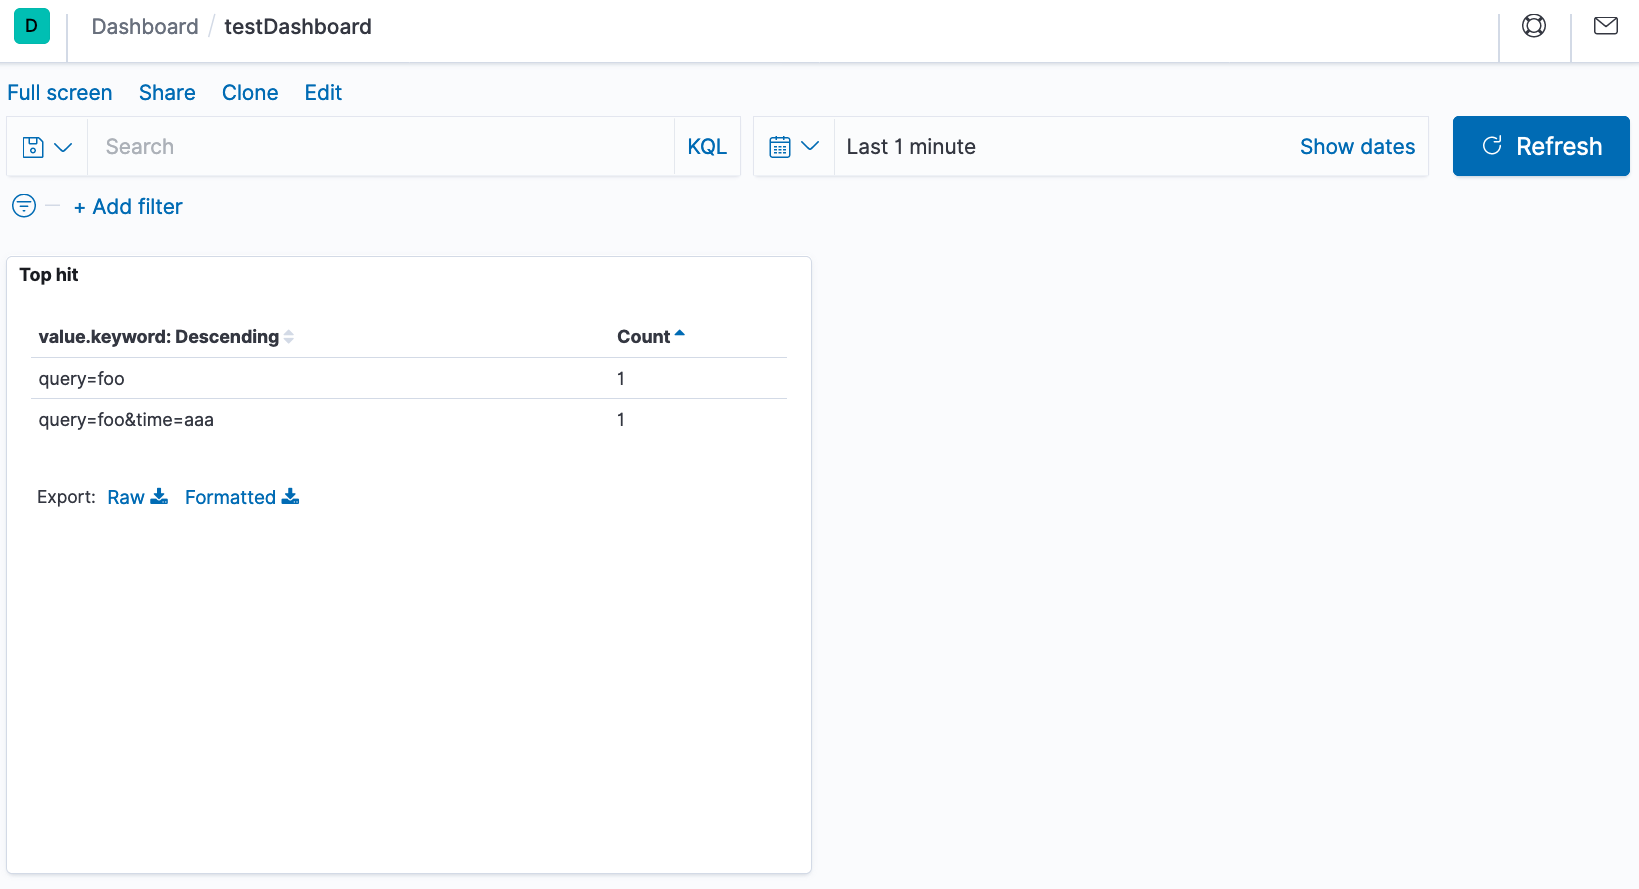
The problem I have is the time filter on upper right corner of my dashboard is not working. For example, I didn't add any new documents to ElasticSearch in past 1 minute, and when I put Last 1 second in time filter I will expect to get zero records. But in fact I still get all records in my dashboard. It looks like Kibana does not take effort of the @timestamp or time fields. Am I missing something to make the time filter works?
Thanks.