HI,
I am trying to create a netwoek traffic visualization based on timelion.
Network traffic should easily be represented by following expression in timelion: .es(index=metricbeat*, timefield=@timestamp, metric=max:system.network.in.bytes).derivative()
But here are some findings:
-
for short time periods (less than hour) it is not producing the results
-
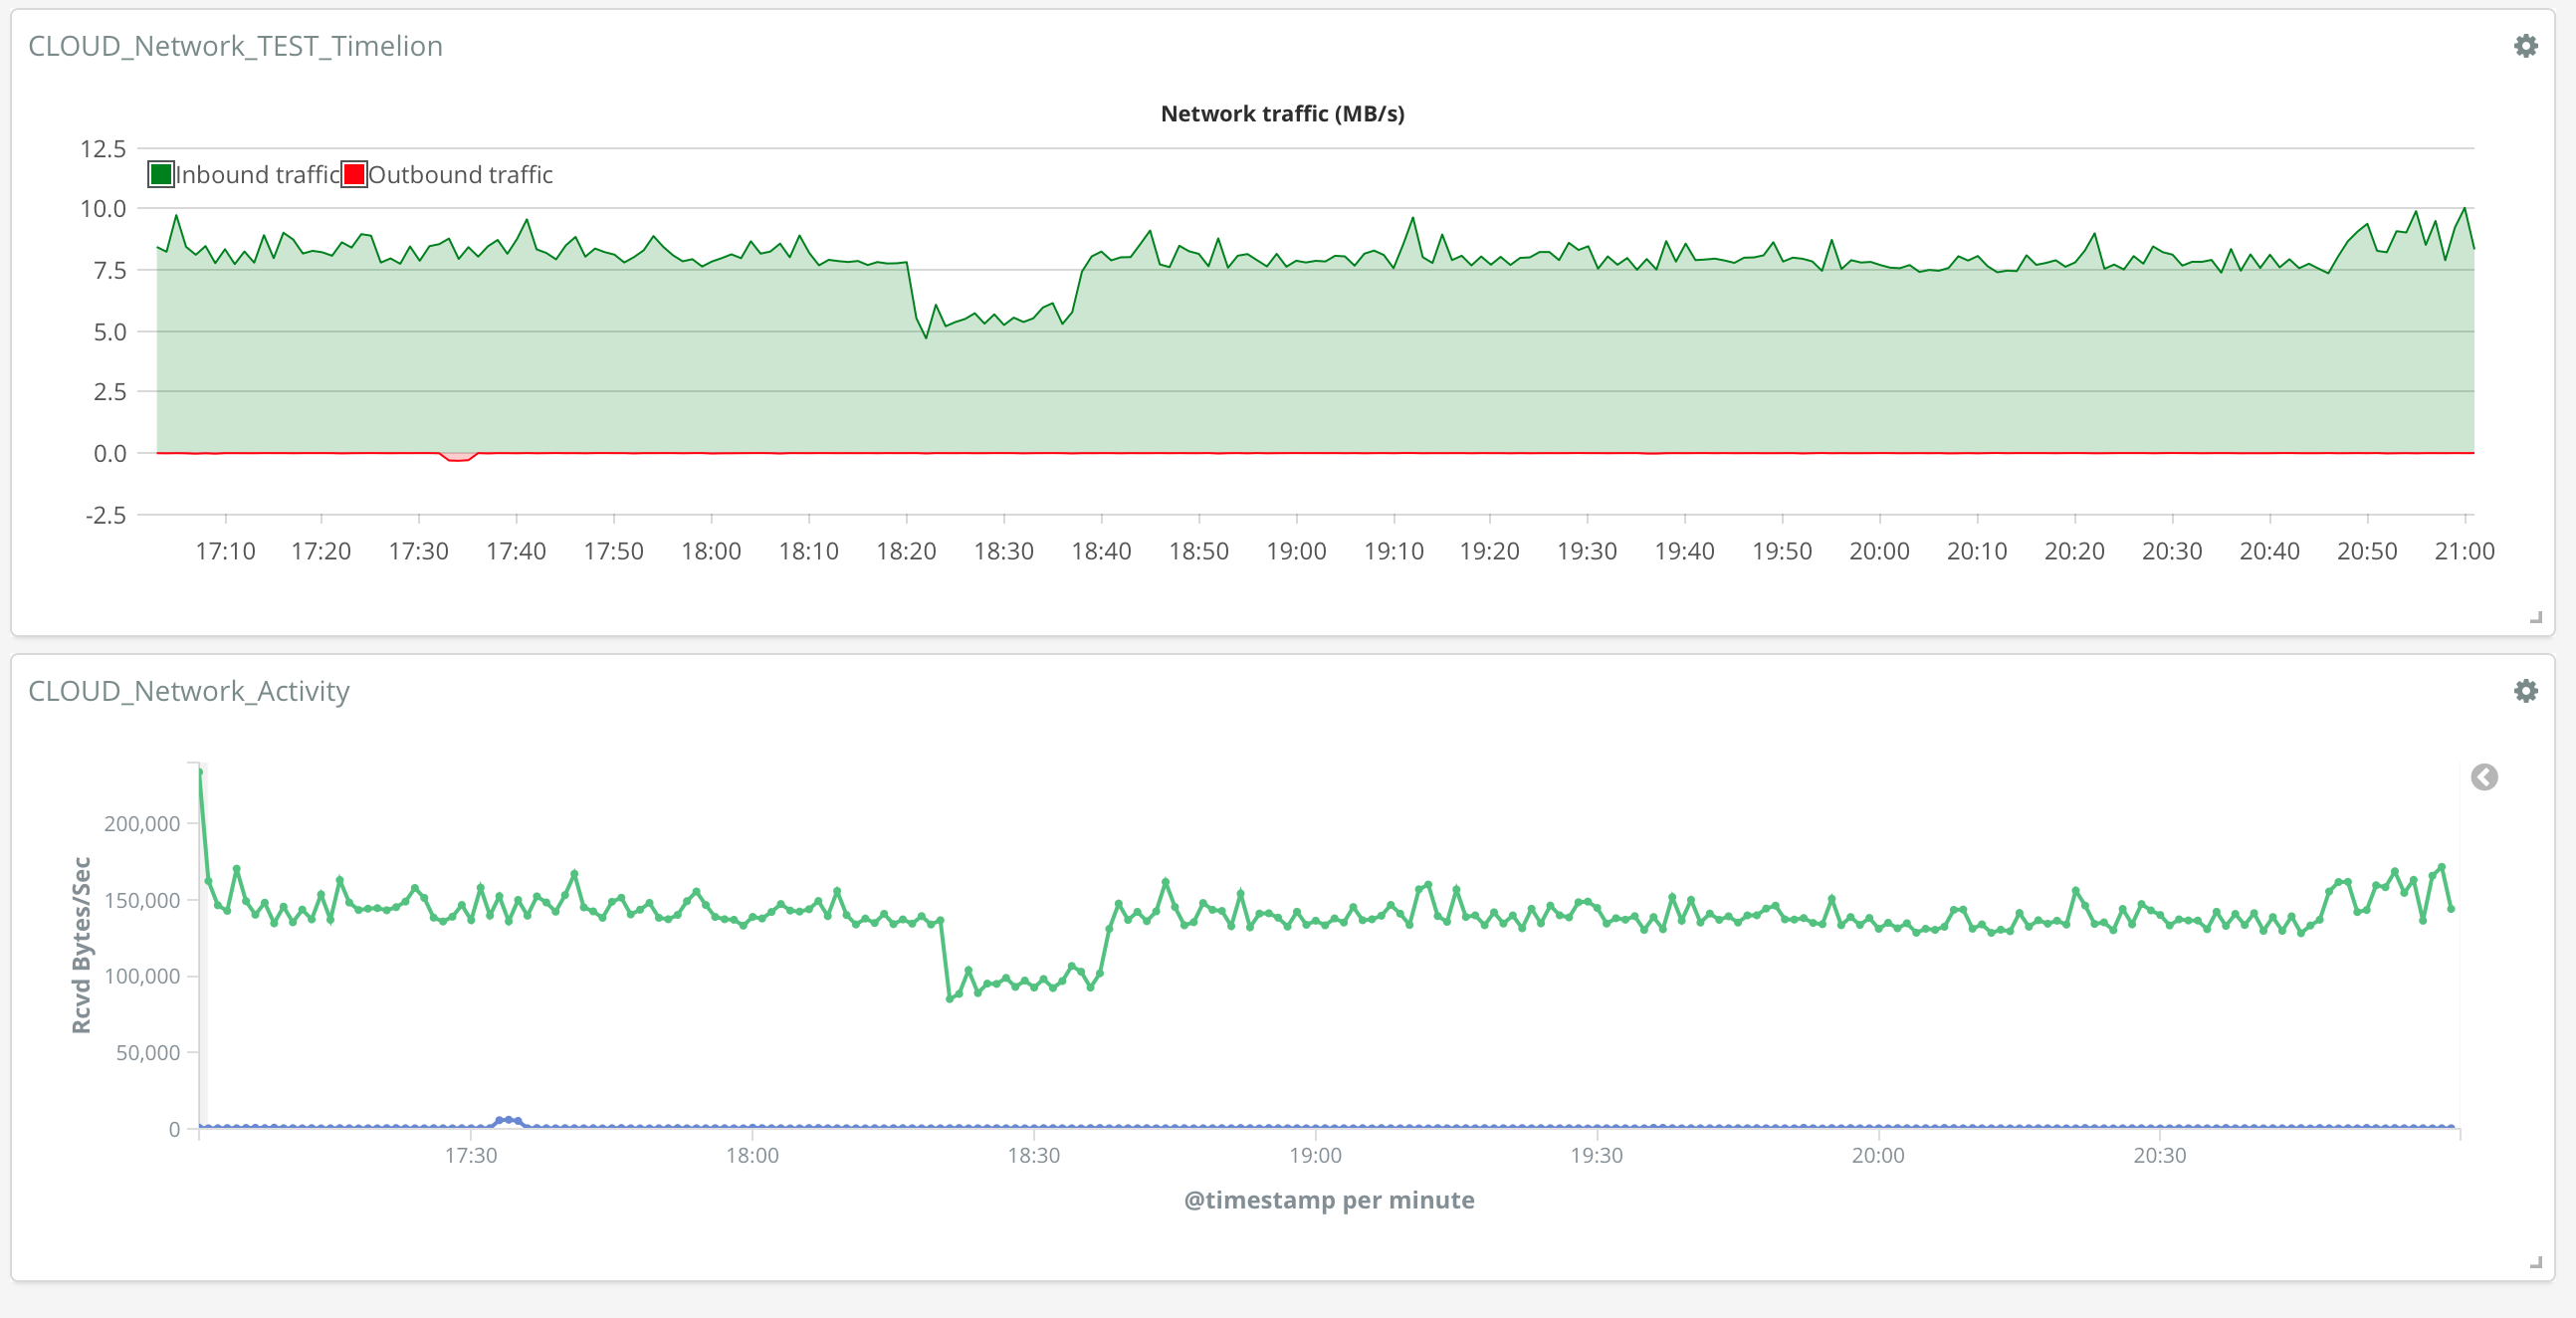
for longer periods it is creating the result and is following the trend, but results are off for big margin (below graph is based on windows perfmon counters and these are real numbers)
-
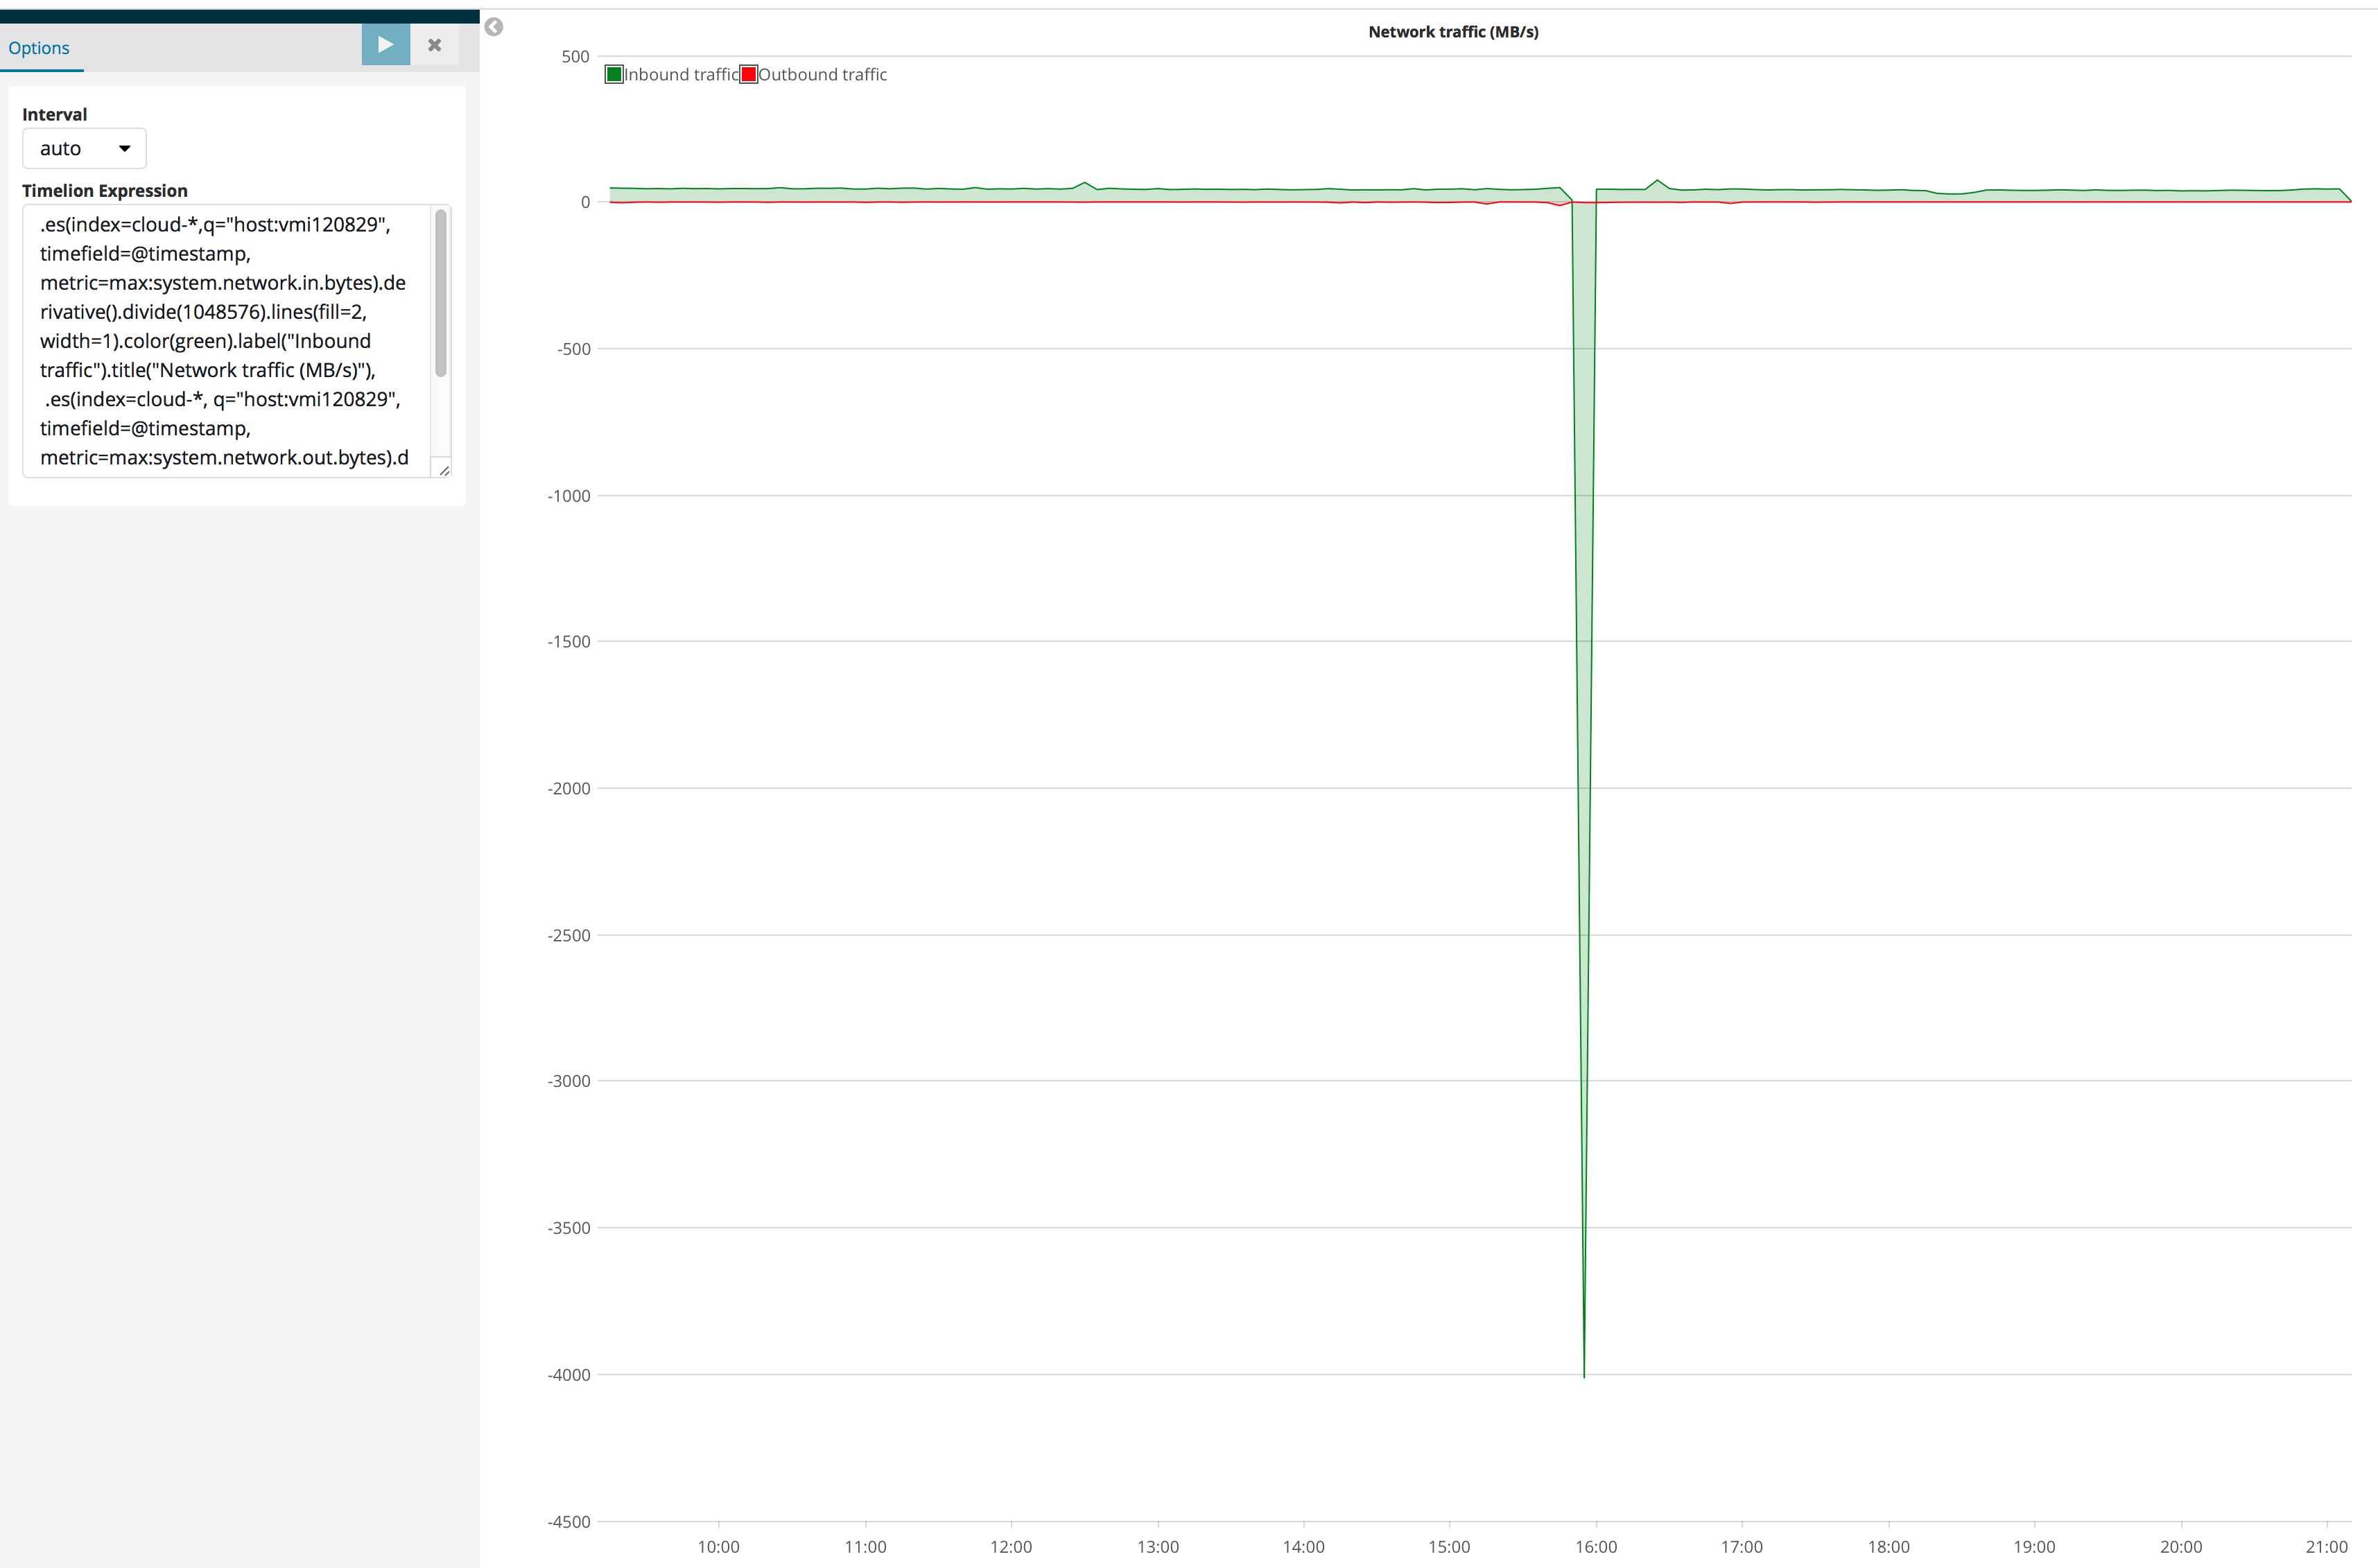
here is the timelion definition
-
for long time periods it looks like counters reach maximum value and upon reset it creates a strange spikes - how to ignore/overcome this


Thank you!
DiNo