Any help please i'm new with kibana , After creating an index that contains all the metrics of my spring-boot app I would like to make some visualization like the following in the picture .
I used the visual builder to obtain real time visualition , but unfortunately no data is apperaed , have you any idea about the right method to perform this dashboard

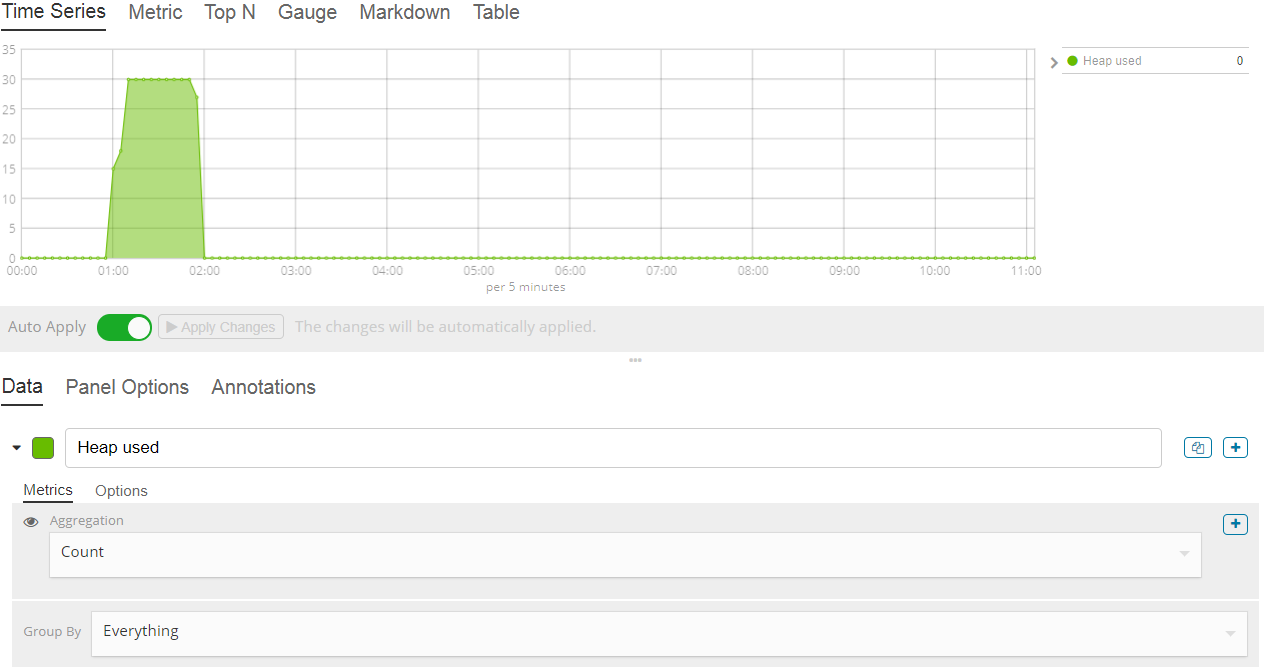
My own configuration when i put max and choose heap committed as a field , there is no data displayed !