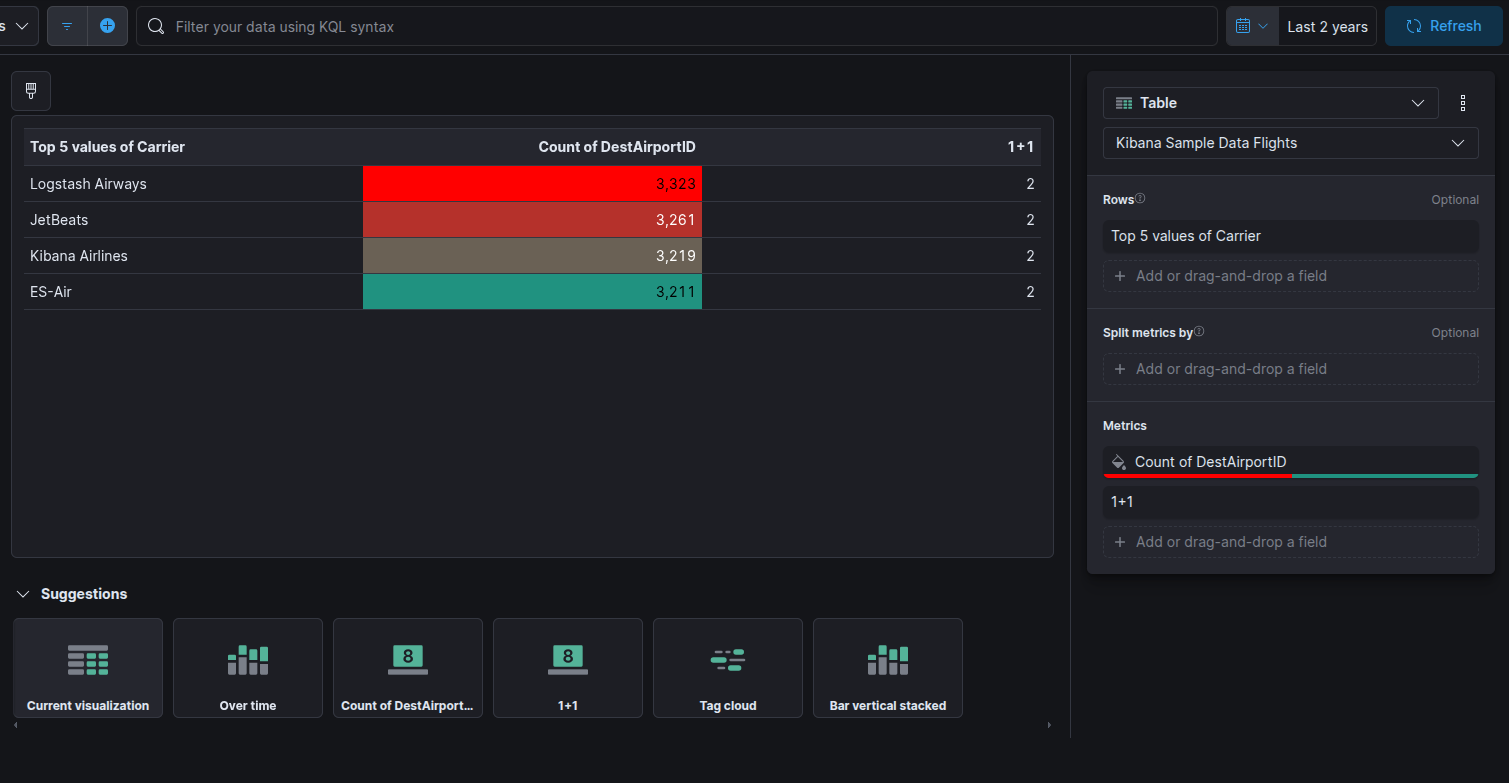
I’m using the Sample Flight data set and I’ve created a Lens Table with “Rows: Top 5 values of Carrier” and Metric “Count of DestAirportID”. I set the metric to color by value (Cell) with value >= 3000 as one color and anything less as another color. I can add more metrics with separate color options and the table works correctly, but as soon as I add a metric that uses a formula, it changes the coloring of other metrics. Example, I added a simple metric with formula “1+1” and this is the result:
I’m using the Sample Flight data set and I’ve created a Lens Table with “Rows: Top 5 values of Carrier” and Metric “Count of DestAirportID”. I set the metric to color by value (Cell) with value >= 3000 as one color and anything less as another color. I can add more metrics with separate color options and the table works correctly, but as soon as I add a metric that uses a formula, it changes the coloring of other metrics. Example, I added a simple metric with formula “1+1” and this is the result:
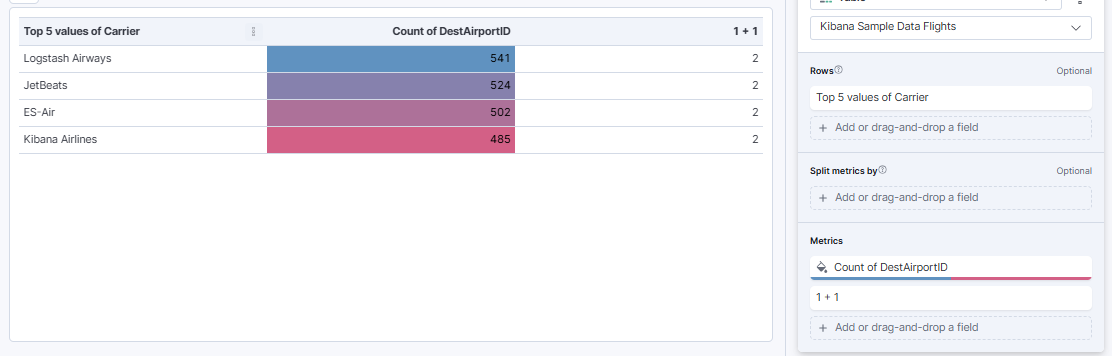
@Tortoise Thanks for your reply. The workaround you provided is not working for me. However, I did find a different workaround. I moved the formula metric above the “Count of DestAirportID” metric and now the coloring works. I added more metrics, and as long as I keep the formula metrics above non-formula, all the coloring works.
Apache, Apache Lucene, Apache Hadoop, Hadoop, HDFS and the yellow elephant
logo are trademarks of the
Apache Software Foundation
in the United States and/or other countries.