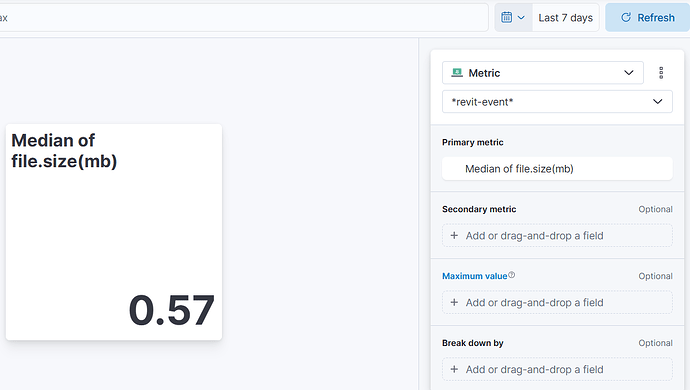
I would like to create a Metric visualization using Lens similar to one mentioned in the post below:
https://discuss.elastic.co/t/metric-background-change-based-on-last-week-value/345082
How can I add a graph underlay to my Metric?
On Kibana 8.17


