Line charts not shown correctly after migrating from 5.1.2 to 5.5.2

Hi all,

I am running a single instance of ELK on one server installed by using the tar files.
Currently I am preparing an update from 5.1.2 to 5.5.2 on a local dev environment.
I just stopped ELK 5.1.2. merged the config from 5.1.2 into 5.5.2 and started the new version.

Now I am checking if our dashboards are still working, and unfortunately I have some issue found:

some lines are not shown. If I move my mouse over the blank area, I get some tooltips at the points, where the graph should be.

image

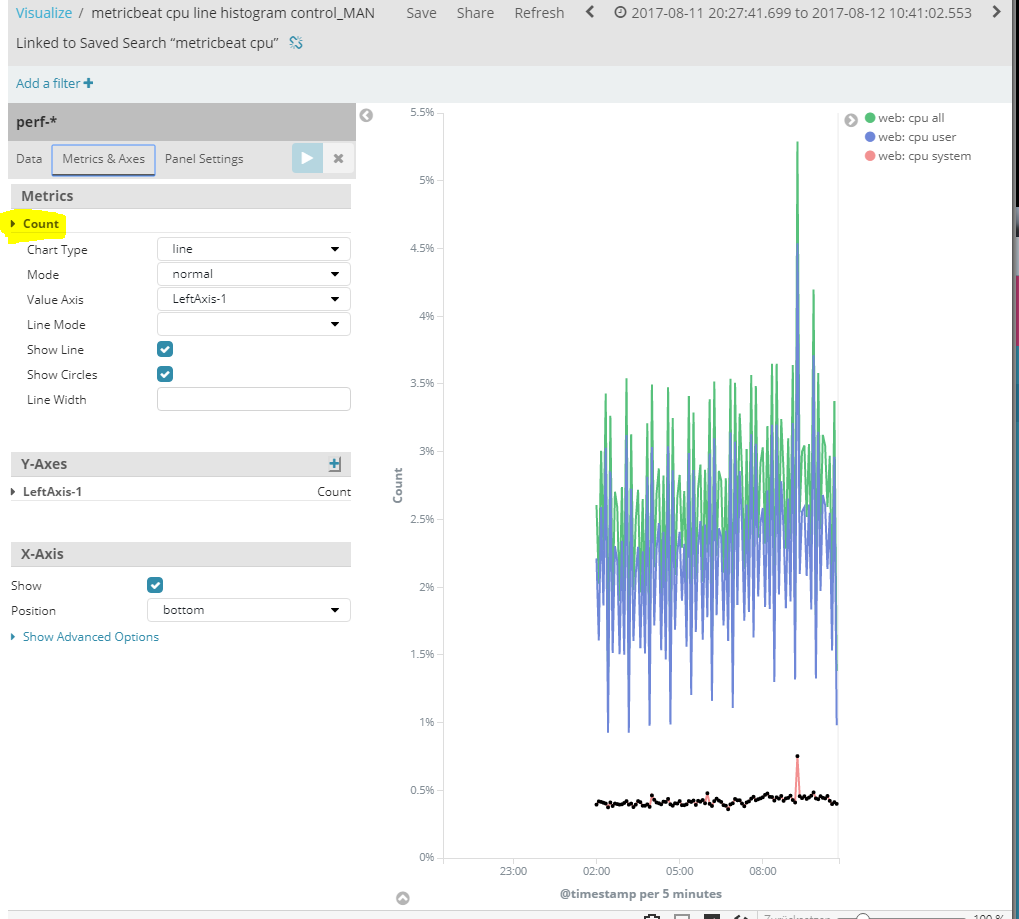
If I go to the vizualization, then everything seems ok: All 3 lines are shown:

Any Ideas?

Thanks, Andreas

I think I found the issue.
I noticed that some charts with multiple lines are working fine and on some only 1 line of many is shown.

Here is my configuration, how it is shown in 5.5.2 of a broken chart:

currently it looks like, that only charts are affected, which are showing multiple metrics. If I split per term and show the same metric, it works.

If I check the Metrics & Axes tab, you can see the following:


You can see a count metrics, but I only have configured avg metrics.

And now, if I reload the viz page by hitting F5 (without saving anything) and commit the changes by using the "play" button, I get the following:

all correct metrics are shown. after saving the viz it is shown correctly in the dashboard.

So where is the problem? Did I miss anything during the migration? Can I automate it, because we have hundreds of panels...

Thanks, Andreas

I withdraw the point, that all term splitted charts are ok.

I'm glad to hear you were able to resolve your problem.

Thanks,
CJ

This topic was automatically closed 28 days after the last reply. New replies are no longer allowed.