What steps have you taken to set up APM with the Ruby agent? Do you see any data already in the Kibana APM app or is the data there and you'd like to do extra aggregations on it?
Let us know so we can help!
Emily
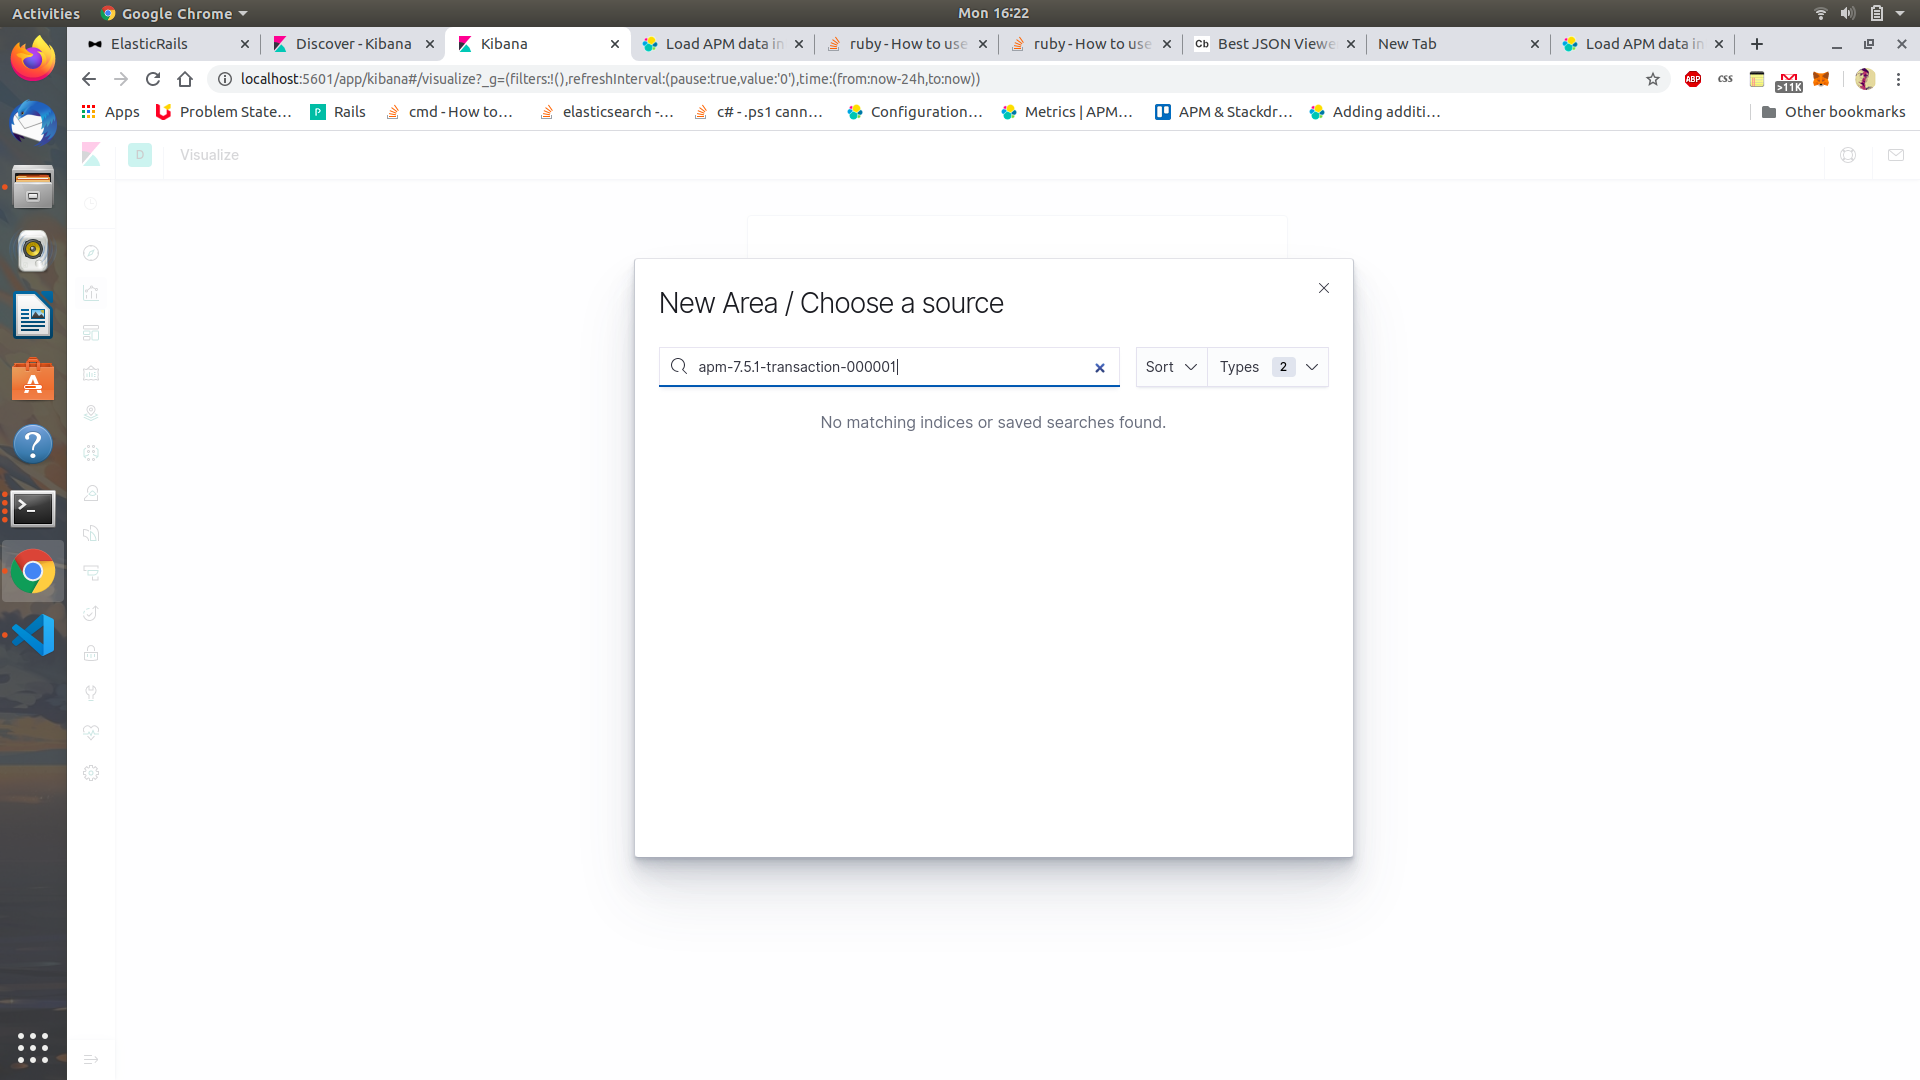
Since, all the transactional information of my rails application gets stored in elastic search . I would like to build the separate Kibana dashboard consisting of charts based on the data stored in elasticsearch.
Hi @Sudarshan013
Thanks for the additional info. I would recommend using the apm-* index pattern to query. Can you tell me more about what you are trying to find in the data so I can give more specific suggestions?
Thanks,
Emily
Apache, Apache Lucene, Apache Hadoop, Hadoop, HDFS and the yellow elephant
logo are trademarks of the
Apache Software Foundation
in the United States and/or other countries.
