While using monitoring in 5.3 we've noticed that the Logstash overview appears to be summarizing the EPS incorrectly. It appears to be displaying a single logstash node EPS count rather than a summary of all active Logstash nodes.
If we have 4 nodes processing ~1500 EPS, the LS overview should reflect an approximate count of 6000 EPS. Instead, it is showing ~1500 EPS in the overview. Meanwhile in ES Monitoring the aggregate EPS ingestion count appears correct. If you drill down in monitoring to individual LS nodes, the EPS data appears correct.
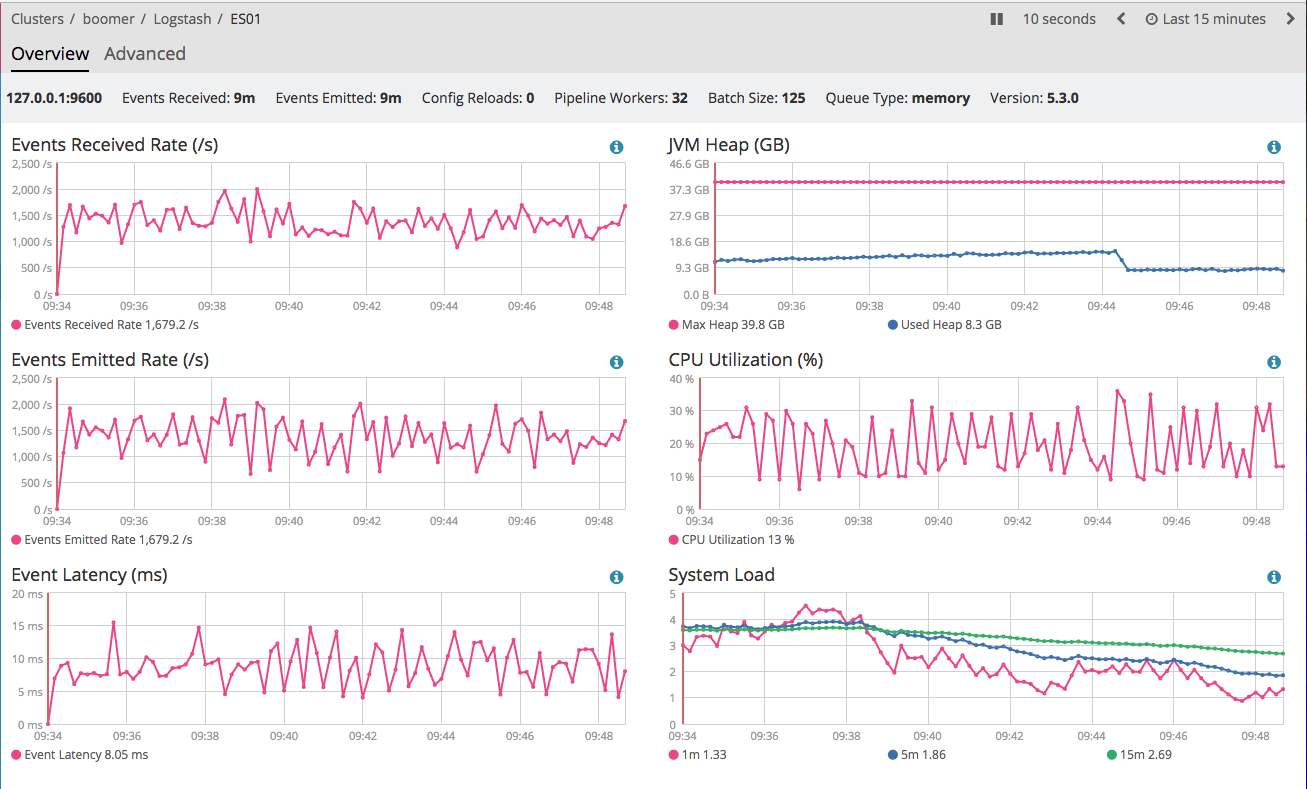
The incorrect overview:

One of the (4) LS node drilldowns:
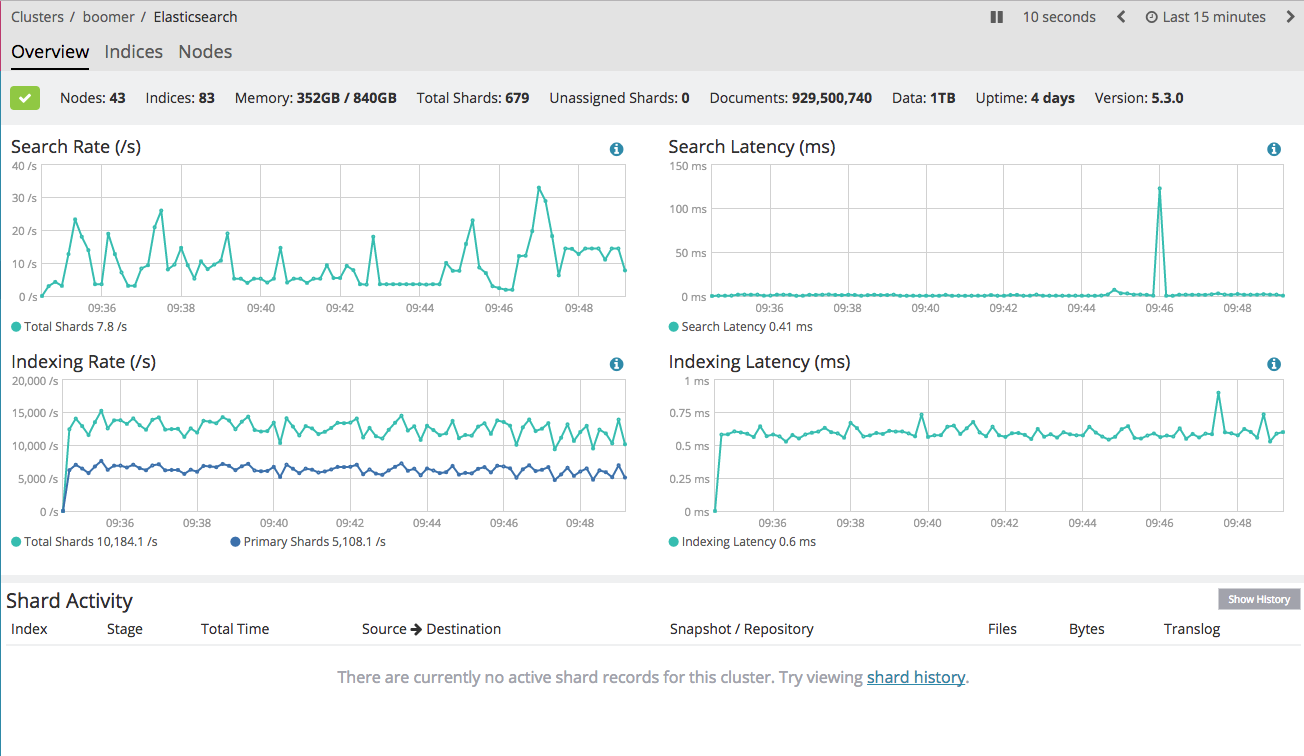
ES Overview showing the correct aggregate EPS count being ingested:
This has been previously reported here: Possbile Kibana bug for Logstash monitoring