We have a (Windows) logs stream pulled out of Kafka and pushed into ES. During site events our rate can spike to many multiples. When this happens, Logstash appears to delay messages getting in to ES.
It's not due to ES indexing slowly. The system (i.e., Kafka + Logstash + ES) gradually increases total throughput over the course of a few minutes. When the whole thing finally hits its stride, it's fully capable of throughput at a rate matching the actual log generation rate.
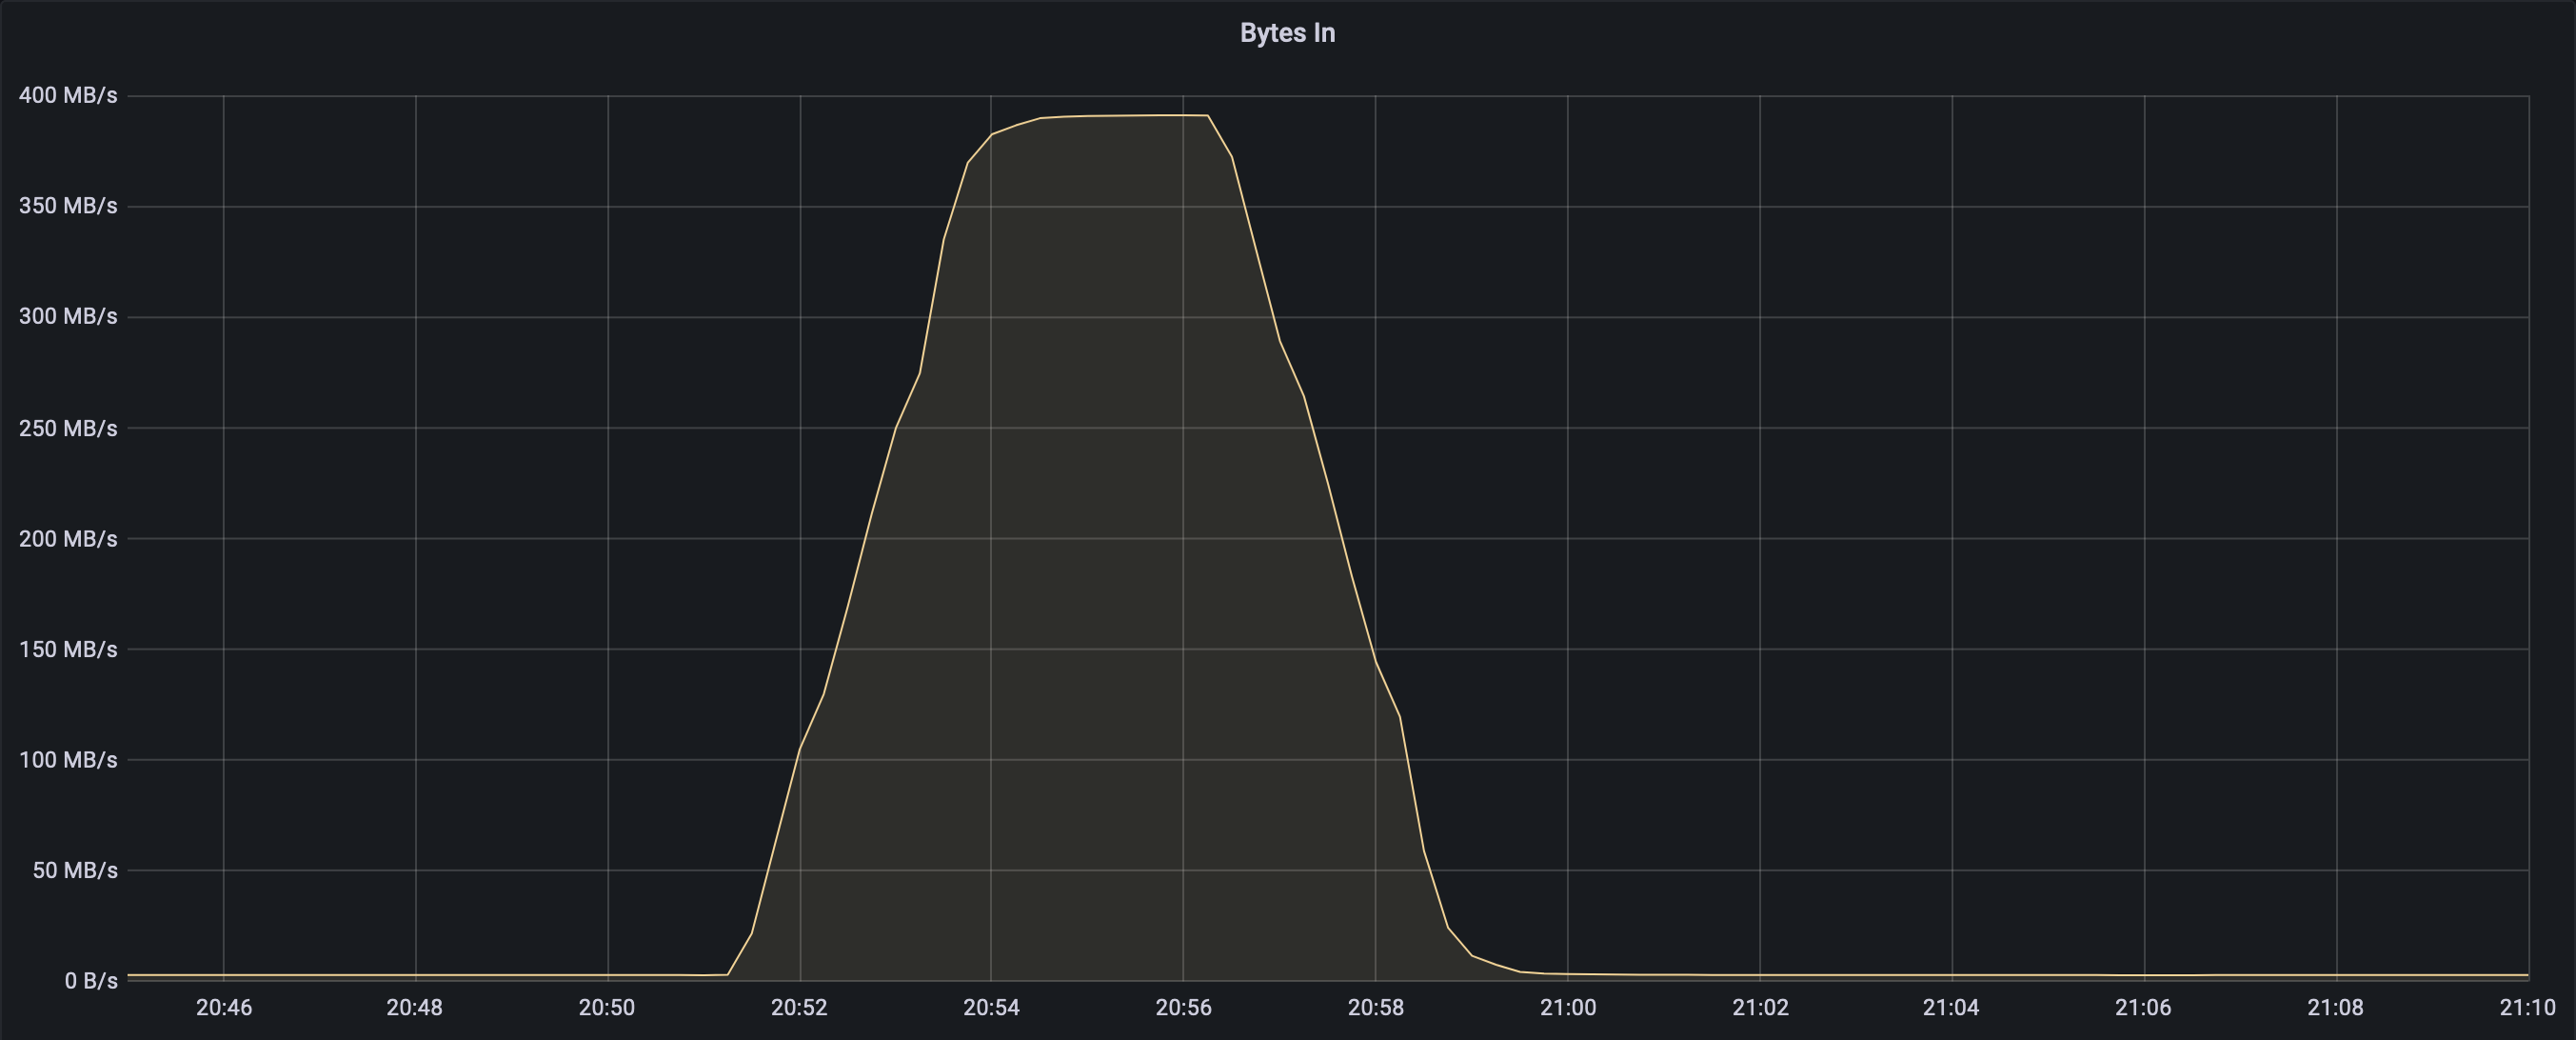
In a particular example, we had a surge of logs that looks like this (once they're finally all in ES):

Getting the documents ingested into Kafka introduces some smoothing out/delaying of that curve:
Okay, but then Logstash takes a while to read that info out of Kafka, which I think is because Logstash is otherwise busy processing:

And we can see Logstash totally stumble on trying to process the logs and output to ES:

And it seems it's having a hard time due to CPU usage. (We're running 15 Logstashes.)

Okay, so you might think, "Give those Logstashes more CPU or make more instances." Well, we have another logs stream that regularly handles far more QPS with fewer Logstash instances and far less CPU with a virtually identical Logstash configuration.
I'm thinking there might be something with how the throttle filter is working.
  # For any messages whose throttle_key;throttle_key2 combination is exceeding the allowed rate we first must tag and
  # then check the tag after.
  throttle {
    period => 60
    max_age => 3600
    before_count => -1
    after_count => 1200
    key => "%{log_name}"
    add_tag => "__throttled"
  }
  if "__throttled" in [tags] {
    # The metrics plugin emits _new_ documents in the _current_ pipeline. There will be one field in the document for
    # each value of logstash_throttle_key that gets into this plugin within each flush_interval.
    metrics {
      add_tag => "__metric"
      meter => ["ratelimit_%{log_name};none"]
      rates => []
      clear_interval => 86400
      flush_interval => 5
    }
  }
  if "__throttled" in [tags] {
    # Importantly, this REQUIRES its own if block. If we put it in the if block above after the metrics plugin then
    # all of the produced metrics would be dropped as well.
    drop { id => "ratelimit" }
  }
Specifically, I suspect throttle might be having trouble managing its timeslots.
There are two main differences in the data content between this problematic stream and the one that's far snappier / unproblematic. The first is that the snappier stream has smaller document sizes, at about 1/4 on average. The second is that the snappier stream has less consistent timestamps. (That's relevant to how throttle uses its timeslot caches / memory.) That is, the problematic stream has timestamps with a lot of accuracy, whereas the unproblematic stream has a lot more poorly synchronized clocks. Though this second difference would make me expect poorer timeslot/memory handling by throttle on the snappier stream's side.
Again, I think it's important to keep in mind that the throughput works up to adequate throughput but does so slowly. It's not a matter of topping out, but accelerating.
Any thoughts on where the delay may be happening and why?