Anyone have any idea why a Watcher would trigger an alert when there's nothing there? Anomaly detection is kind of the whole point of our use of Elastic as a SIEM, and if it can't be trusted, we need to look for other solutions.
By "add it to the query", should it be nested in a filter statement? Or should it be at the same level as the ""bool" or "filter" that are auto-generated by the system when it creates a Watch?
Also, how would I be able to tell if this works? Is there a way to replay a Watch against historical data, since this email triggered was back in March?
Hi Josh - well, it would be nested in the filter part of the statement. But, your subsequent question about re-running the Watch against historical data has got me reconsidering the nature of the problem you're reporting.
So, help me understand how often this is happening? I originally thought it was happening routinely (as in every bucket_span) and that my suggested workaround would alleviate that.
So, if that's not the case, then how often are you seeing this? Is every alert email showing a "ghost" anomaly that you cannot link to or do some of the alerts link to "real" ones?
Also, it might be handy if you create a kibana index pattern for .ml-anomalies-*. Once you do that, you can use the Discover tab to search for the anomaly records. For example:
It's definitely not happening every bucket_span (which is set to 60 minutes).
It's also not on a regular cycle. We get email alerts every few days, and most of the time when I click on the link in the Watcher, what I see in the Anomaly Explorer view doesn't have any connection to what was in the email.
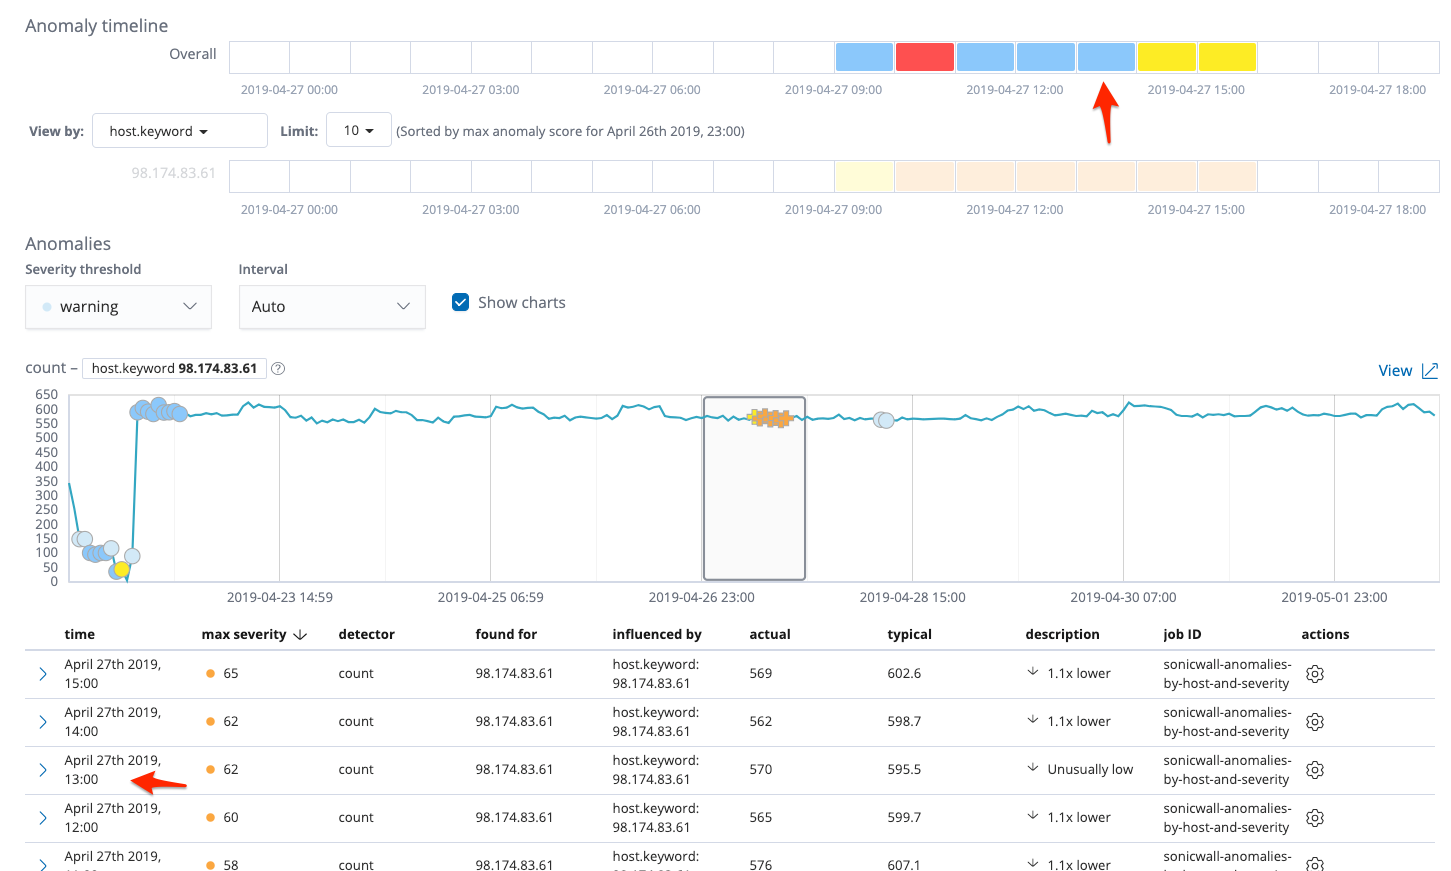
For example, here's the most recent email from April 27 (six days ago at this point):
But when clicking on the link, I don't see any anomaly in that time window even close to an anomaly score of 94. There were some anomalies (highlighted by red arrows), but none that should have reached the level of severity to trigger the Watch.
The index pattern is making things even more confusing.
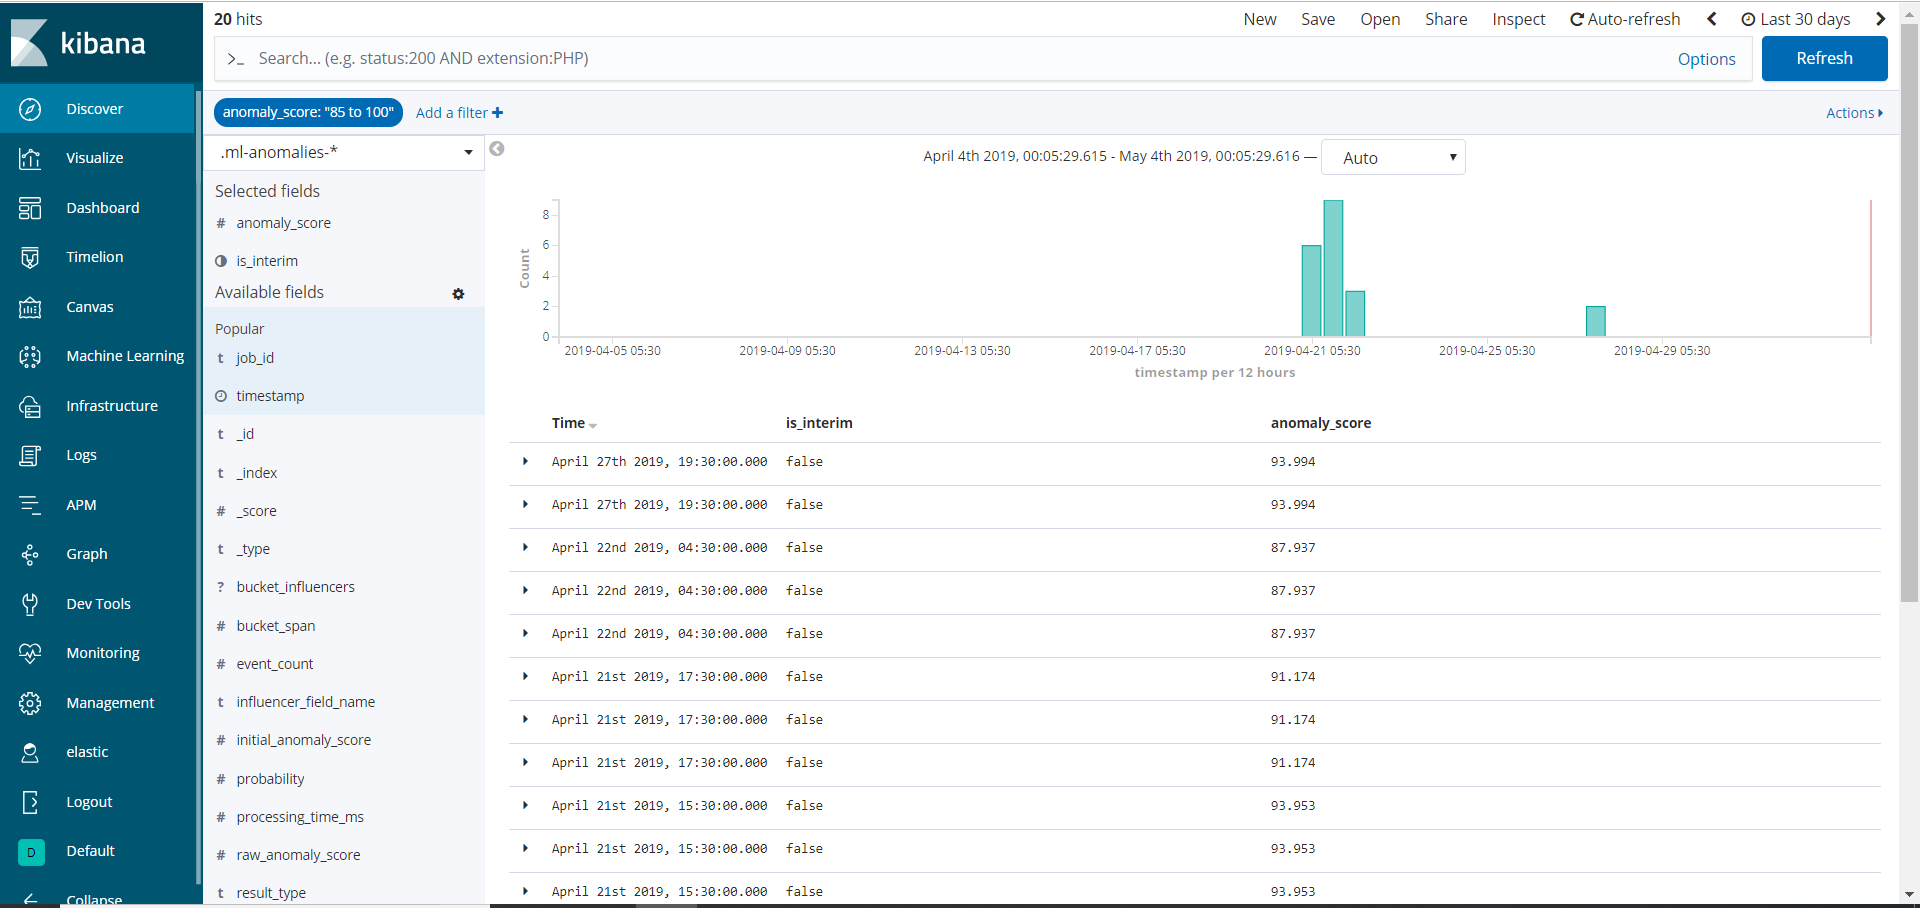
Here's the highest anomaly scores:
And if I look at the Anomaly timeline, it seems to match up:
But when I click on that hour in the Anomaly timeline, no anomalies with a score of 93.994 show up on the Anomaly Explorer page. Here is where I would expect to see the anomaly:
But as you can see, there's on an anomaly with a score of 54 showing up for that hour. And there's only one, not the two that we can see in the new index pattern.
Also, every alert with a score higher than 85 has interim set to false --- here's a screenshot.
Ok, now this seems like this is a timezone issue. Hmmm....Are you in a timezone that is exactly the number of hours behind UTC as the anomalies that you're finding in ml-anomalies-*? What time zone are you in and what timezone is your kibana set to use?
Also when looking in ml-anomalies-*, you should look at a field called initial_anomaly_score as that is what the score was at the time the result was first written. The anomaly_scorecan be revised at a later time, but initial_anomaly_score will never change once written.
(by the way - you probably can remove the is_interim filter on your watch search since it seems like you're not plagued by that other bug. The is_interim is only briefly set to true when the latest bucket is still collecting data - within the current hour in your case)
Hi Rich - we're in the eastern time zone (UTC-5). Timezone is set to "browser."
It seems that the data has changed yet again, which is really scary.
Now when I look in ml-anomalies-*, there is no value anywhere near the anomaly score of 94 that was in the email from April 27, 2019, or the 93.994 that was in the ml-anomalies-* screenshot that I posted here on May 3 based on data from April 27, 2019.
When I looked in ml-anomalies-* today (May 6), here are the highest scores for anomaly_score, sorted in the descending order:
Also - not entirely following your logic about timezones. I agree that this would explain a time of 13:00 in the email alert and a time of 10:00 in ml-anomalies-*, but that doesn't seem to explain why there are different numbers showing up in different parts of the user interface.
Hmm... I cannot immediately explain the anomaly score discrepancy unless your watch was really returning and alerting upon the record_score and not the anomaly_score. There are several different kinds of result_type documents in .ml-anomalies-*. They include:
bucket - which is an aggregation/summary score of the time period of the bucket span
record - which is the detailed score of an individual occurrence of an anomaly inside a bucket
influencer - an entity-centric version of the scoring
I now suspect that the watch is returning something different than the anomaly_score that you're comaring against. You could validate this by either:
Posting the full code of your watch for me to see or
Looking at the watch code yourself and working out what value it is returning and comparing that against a look in .ml-anomalies-* for one of the other result_type documents
Also, it is possible that the logic in the watch is incorrect with respect to the time zone. It is likely that there is some scripting that is in the watch to buld the "start" and "end" time for the email link that says "Click here to open in Anomaly Explorer". It is possible that the logic used in building that link is pointing you to an incorrect window of time.
Sorry, I threw us a red herring here. We have two similarly named ML job ID's, and I was confusing them in my most recent post. Please disregard my comments about the numbers not agreeing.
So, to recap where we are, email alert came in April 27 at 9:12 am eastern time:
As for the last part (the data that is in the table) - those are the record_score entries. So, you need to compare what you see on the screen there with entries in .ml-anomalies-* that have result_type:record and look at record_score and initial_record_score
Hi Rich - thanks for nagging me on this, missed yesterday's notification.
In .ml-anomalies-*, when I filter down for result_type: "record" and job_id: "sonicwall-anomalies-by-host-and-severity, I see numbers that match with the bottom of the Anomaly Explorer page:
Any tips or documentation to help me to understand, in practical terms, the difference between the "record" score and the "bucket" score? I thought all of the anomaly detection is comparing the count in each bucket, so I'm not sure what the "record" score is supposed to be telling me?
The results API docs detail what's contained in the different results types, but the blog you mentioned is also a good source. I have written a full reference book on Elastic ML, so if that's interesting you can look into that as well.
To understand the difference between bucket-level anomalies and record-level anomalies, you need to consider the case that for some ML jobs, there are possibly many entities being modeled (if the job is split) and technically there can be multiple "detectors" configured per job. Therefore, any one instance of an anomaly - for either a particular detector and/or a particular entity would result in a results record. The bucket level score is the aggregation of all anomalies in that bucket. There would be a difference, for example, if 1 out of 100 hosts were unusual in the last bucket versus 99 out of 100 hosts. The latter would obviously command a higher bucket score.
Hi Rich - it helps conceptually, but I'm still struggling a bit with how to use this in practice.
This specific machine learning job is simply looking for an anomalous count of firewall logs, with a partition of "host.keyword" (which is the IP address of the sending firewall). Our goal is to get an alert when any individual host sends either an unusually high or unusually low number of records in any given hour, as compared to other hours. The bucket_span is set to 60 minutes.
Given that goal, should we be paying attention to the record-level anomalies or the bucket-level anomalies? And also, in this use case, what would make an individual record anomalous, since each record is simply a firewall log entry?
When you have a job with splits (like you do, splitting on host.keyword) AND your goal is to get an alert when any individual host is unusual, then yes - you should be working with result_type:record entries in the results index. What this means, of course, is that if there is a widespread problem affecting many (let's say 100) hosts within the same bucket span, then you will get 100 anomaly records, one for each host. Conversely, if you were only querying at the bucket level, you would only get 1 result doc per bucket_span and you might not know which host(s) were unusual in that bucket, unless they were prominent influencers.
In this watch, the results index is queried for any occurrence of any entity (in my case, this was a job split on an airline code) with a minimum record_score of 90. (Also note that this watch isn't built for real-time, as it searches over a multi-year history of results).
One small detail that this example watch omits. Since the default size of a query in elasticsearch returns 10 hits - if you expect more than 10 results, you should add a size parameter to the query. For example:
Apache, Apache Lucene, Apache Hadoop, Hadoop, HDFS and the yellow elephant
logo are trademarks of the
Apache Software Foundation
in the United States and/or other countries.