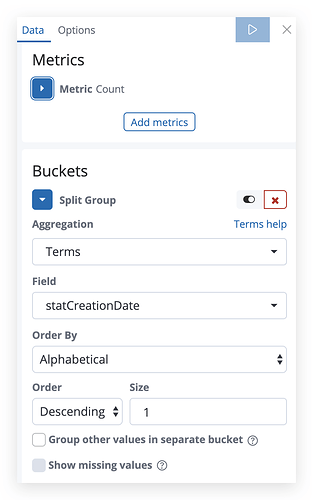
I'd like to mix in one dashboard historic data (a date histogram) with simple data e.g. a metric vis that should show metrics of the latest date inside the currently selected timepicker range.
Say my date field is statCreationDate, is the following the right approach to achieve it?
You would have to create to different visualizations and then add them to the same dashboard.
First would be the metric visualizations for the latest value. This is how: Display latest value in a „Metric“
And for the second, just set a Date Histogram on the startCreationDate field in a line/area/bar chart.
Hmm, the Top Hit Agg allows me to display a single value for e.g. my latest timestamp.
However I want to display a metric on the latest timestamp: e.g. in my initial screenshot I want to have a Count metric (or as another example a sum metric on some field).
Your suggestion seems to work only for displaying a single value of some field but not a metric (but maybe I'm missing something?)
That's what I understood from your initial question. Can you give an explicit example with values and everything? This way I can understand your question better.
Say I have 1000 documents with statCreationDate="10:00..." and another 500 documents with statCreationDate="11:00...". I select the whole day in the timepicker.
A Count metric would show now 1500.
However I want to only count the docs from the latest statCreationDate="11:00..." which should result in 500 docs.
This topic was automatically closed 28 days after the last reply. New replies are no longer allowed.
