I am trying to create visualization using the Visual Builder introduced in Kibana 5.4. After I specify the target index, I have problems setting up the filter to get my target data. Does the panel filter under Panel Options follow the same query language/rule when query the data through discovery?
Is there a how-to guide about visual builder available? I really want to use this feature but I am stuck with the very basic stuff. Appreciate all helps. Thanks.
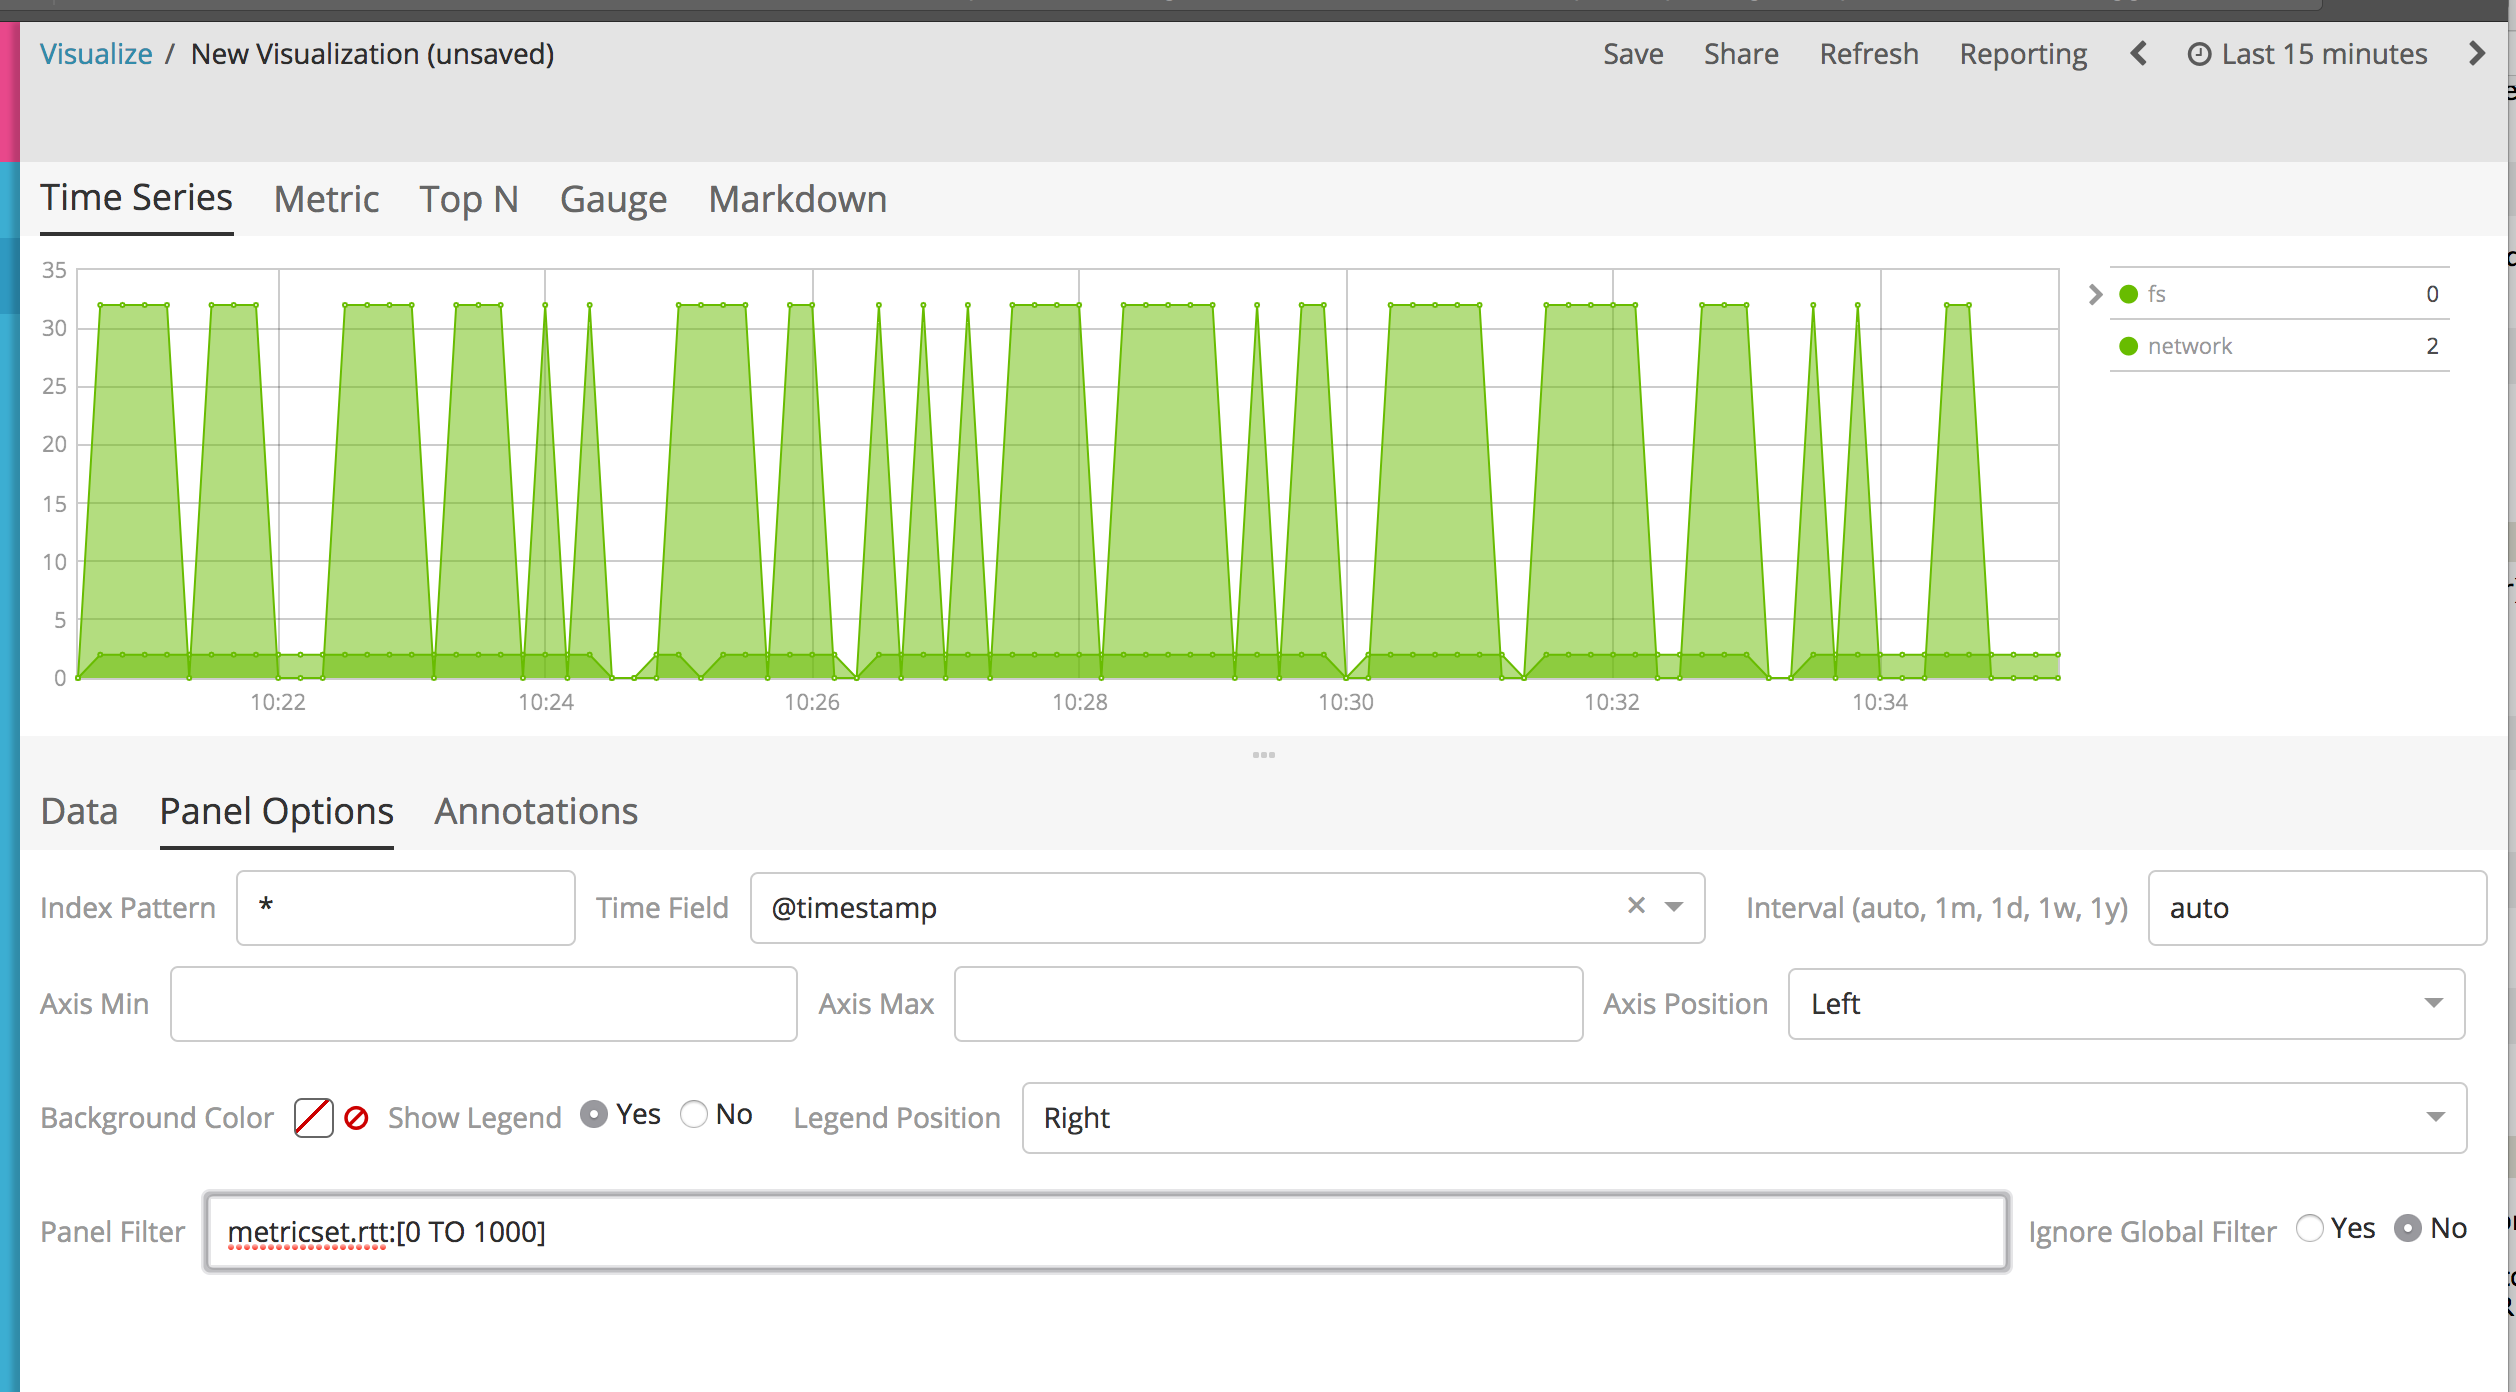
You can filter all your data by a single filter (choose "Filter" under "Group By") or multiple (choose "Filters"). You use the same Lucene expression syntax for these filters as you can anywhere else in Kibana. Here's a simple example of multiple filters on some Metricbeat data:
Thanks for the documentation. I tried, and it didn't work for me.
I just updated to Kibana 5.5 yesterday. What I tried to display is the value from a field called udppm_cpu under the following conditions:
Panel options:
Index name: systest_db-
Time field: @ timestamp (to display the latest value based on when the data is ingested into Elasticsearch.)
Panel filter: apl_name:"mercury" (the udppm_cpu usage of the appliance called Mercury.)
Under Data:
4. Labeled the field as udppm cpu (the label didn't even come up in the display)
5. Metrics/Aggregation: Max (I tried every one of the aggregation, none of them worked)
6. Metrics/Field: udppm_cpu
7. Metrics/Group by Terms; by udppm_cpu; Top: 1; order by max of udppm_cpu.
I can see the visualizations available in the visual builder can really help us create a kick ass dashboard. I just couldn't get it work. I appreciate if you can help me figure out what I did wrong here. Thanks a lot.
Do you see anything if you don't enter a panel filter? If not, then something could be wrong with your index name or time field.
Do you see anything if you start with a Time Series chart? Looking there first may help to make sure the data you expect to see is coming up correctly in the query.
Apache, Apache Lucene, Apache Hadoop, Hadoop, HDFS and the yellow elephant
logo are trademarks of the
Apache Software Foundation
in the United States and/or other countries.