I am tracking the number of hits to a given URL with a simple Metric visualization. I'd like to be able to display an arrow that points up or down if the current metric is higher or lower than the previous measured period. Is this possible?
For example, I have the visual setup to show the number of hits in the last 24 hours. An additional query would run looking at the 24 hours previous to that and then display an up/down arrow if the previous period is higher/lower than the current.
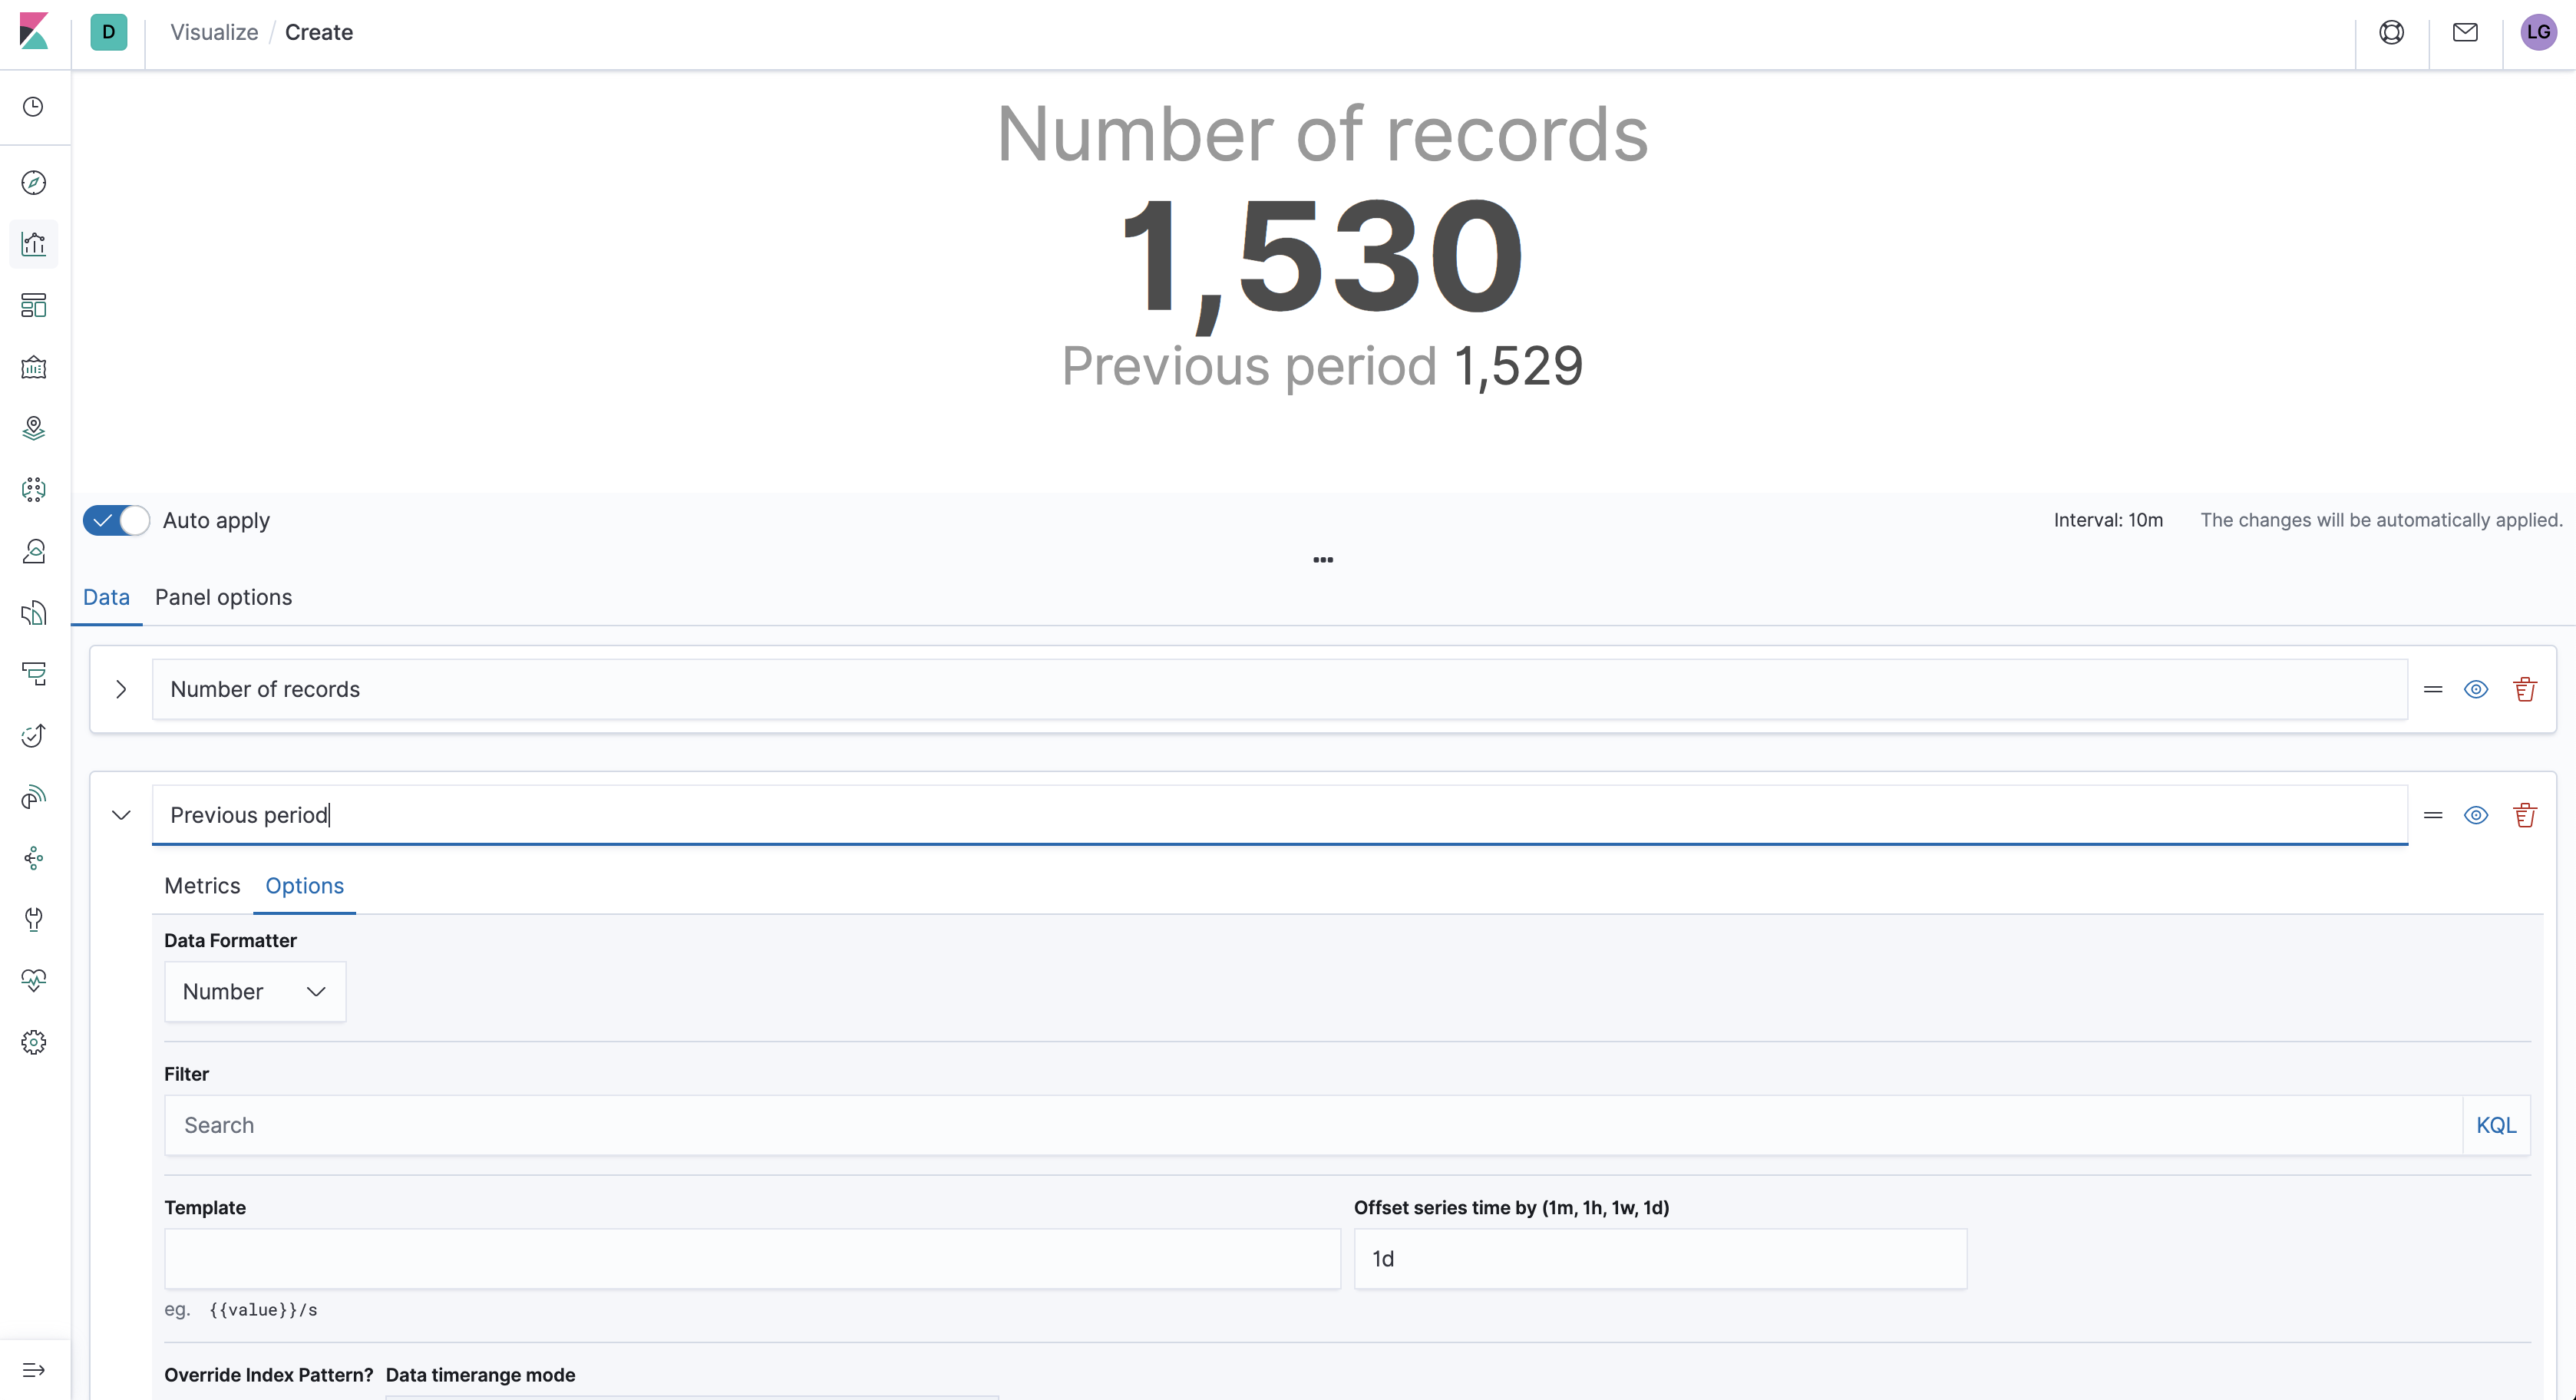
Good question! I'll have to think on this some more, because I can't see an immediate way to do this. The closest I can come is a TSVB Metric visualization with two datasets. The first shows your number of hits for the current period, and the second shows the number of hits in the previous period, using the "Offset time series" feature. This just displays two metrics though, it doesn't allow for an arrow to render in its place:
That gets me pretty close. I was hoping the 'previous period' offset could auto-adjust based on the current period being looked at instead of being 'hard-coded' into the visualization. Just makes it administratively easier to manage...1 visual instead of 10+, but this is pretty good.
Awesome, I've done very little previously with Vega, mostly just adapting Sankey to use in our environment. I'm doing the same thing here, however, I've run into what I assume is a syntax error with the Elasticsearch query, getting an error stating Cannot read property 'time_buckets' of undefined. Here's the query I built:
Apache, Apache Lucene, Apache Hadoop, Hadoop, HDFS and the yellow elephant
logo are trademarks of the
Apache Software Foundation
in the United States and/or other countries.