Hi all,
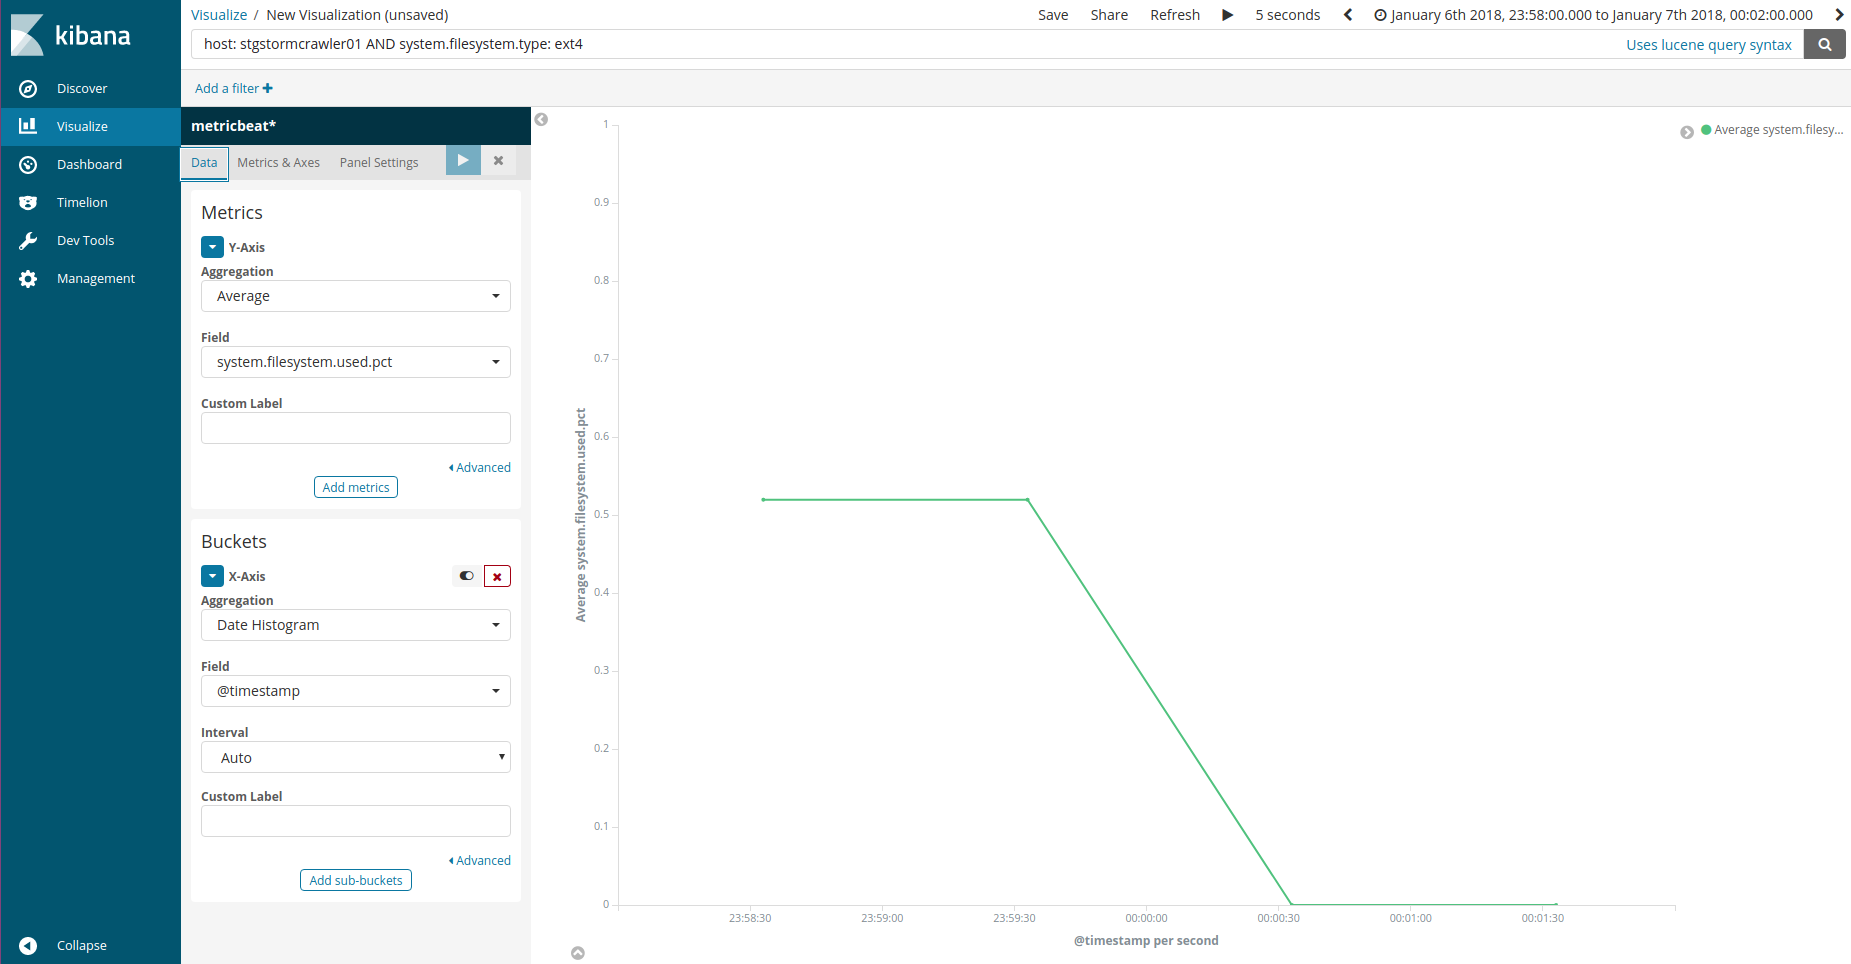
I'm using Metricbeat for system metrics, but every now and then system.filesystem.used.pct returns 0% for 24hrs from midnight, but only when being visualised. This happens whether I use Kibana or 3rd party Grafana. If I query for documents using "Discover", then those documents covering the midnight boundary are non-zero.
My indexes for Metricbeat are created daily, and it seems too much of a coincidence that the data would be missing for precisely the length of an index. To make matters even more confusing, the same indexes visualise information on CPU and memory usage perfectly, whilst the filesystem.used.pct is 0!
Any ideas?
Thanks,
Chris.
Elasticsearch: 6.1.0
Lucene: 7.1.0
Kibana: 6.1.1
Grafana: 4.6.3

hi @directRoot,
I'm not sure about this.
Is this with all graphs or just with line-charts? What if you create a data-table, bucketed by hour, do you also see missing data then?
Hi Thomas,
Thanks for getting back to me.
Yes, the same thing occurs with data tables.
Works for CPU
Doesn't work for disk by the minute...

...or hour

I've also tried the filesystem.used.pct without the "...type: ext4" query; this changes the 0.52 values because it's including other file systems, but the values after midnight remain stubbornly 0.
At least if they were "-" then I'd know Elasticsearch thought they were missing!
Let me know if you want me to try anything else, or need some more detail on setup. I should probably also point out that it is Logstash that's creating the new index at the stroke of midnight.
Thanks,
Chris.

